


“The economic intervention that I’m announcing today is unprecedented in the history of the British state.” – Rishi Sunak
Economic Downturn
Coronavirus – a word we are sure you are tired of hearing by now – has flipped the global economy on it’s head. It has brought record levels of economic downturn – unemployment, negative GDP growth, etc. and with it record levels of government financial aid.
It has exposed the dangers that come with relying on foreign production – as China began to shut down, global firms that either directly or indirectly depended on the levels of production achieved by China began to suffer – which was only the start.
As lockdowns became the norm around the globe, governments have had to step in to support their economies due to the substantial downturn in economic activity – breaking stimulus records in the process.
Such large aid from governments has been praised, providing households with stability and a cushion of sorts to soften the economic blow of covid-19. However, the long-term realities of such significant government stimulus is that this borrowed money must be repaid.
How do governments best raise their revenues? Taxes. Fiscal policy, however is a tricky and long-winded tool – how does a government recoup such massive monies through increasing taxes, if the economy is not yet in a place to provide sufficient incomes to accommodate the taxes required?

“Never in the history of the IMF have we witnessed the world economy come to a standstill” – Kristalina Georgieva, director of the International Monetary Fund
The story so far
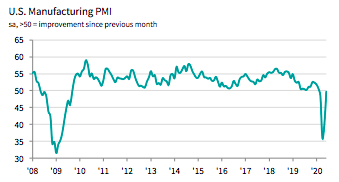
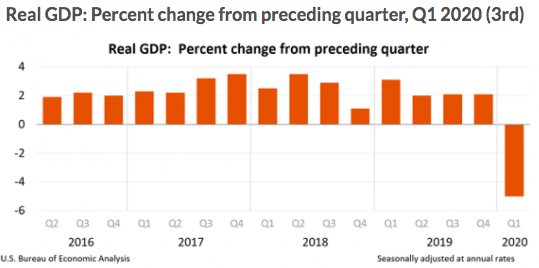
For the US, who are currently experiencing their peak of COVID cases, have been hit by the economic repercussions particularly bad. Unemployment increased to as much as 15%, real GDP declining by -5% in Q1 of 2020 and the purchasing managers index for the US manufacturing fell to within 5 index points of 2008 levels (index as of 1st July 35 vs 2009 index score of just above 30 – with anything less than 50 signifying contraction in an economy).
For the UK, the economic tale of Coronavirus is not too dissimilar. According to the ONS, for the three months up to April 2020, the UK unemployment rate held stable despite COVID, 0.1% higher than a year previous at 3.9%. Although this figure is vastly different from the figures seen in the US, it is important to note two things – firstly, ONS data is sourced from Labour force survey estimates. The interviews this is based on took place from the start of January to the end of March 2020, meaning the majority of interviews conducted were before the implementation of social distancing measures and lockdowns. Secondly, social stimulus responses have differed greatly between the two economies.
If we account for claims for Universal Credit, which can be seen as a precursor to unemployment the impact of COVID on the UK is more worrying. Gov.uk claims “From 1 March 2020 to 23 June 2020, the DWP has received 3.4 million individual declarations to Universal Credit”.
The Bank of England has warned UK unemployment could reach as much as 10% in 2020, with some of the stimulus programmes now winding down, where does this leave the UK taxpayer?
Point of comparison
Before COVID, the most recent and significant economic crash was of course, that of 2008. The financial crisis and COVID-19 are however very different economic shocks in their nature and effect. With the 2008 crash being a financial crisis, rooted within the US housing market and COVID being a health crisis, there are significant differences in the way these affect economies. However, the severity of each means the fallout may not be too different.
In the US, unemployment hit 10% in October of 2009 (30 million people without jobs), and failed to return to below 9% until the October of 2011. US GDP growth fell to as much as -2.5% in 2009 and inflation averaged -0.4% in the same year.
The UK was hit hard too, with unemployment reaching as much as 7.9% in 2009 (which would go on to rise to 8.5% in 2011), GDP growth declining to as -4.2%.
Monetary response
In response to the above economic products of such a deep recession, the US broke records for the level of stimulus provided – By March 2009, the Federal Reserve had pledged a total of $1.25 trillion in Mortgage-backed-security purchases, $200 billion in federal agency debt, and $300 billion in longer term treasuries in attempt to support the housing market, increase the money supply and depress long-term interest rates. (FOMC Statement March 18th 2009).
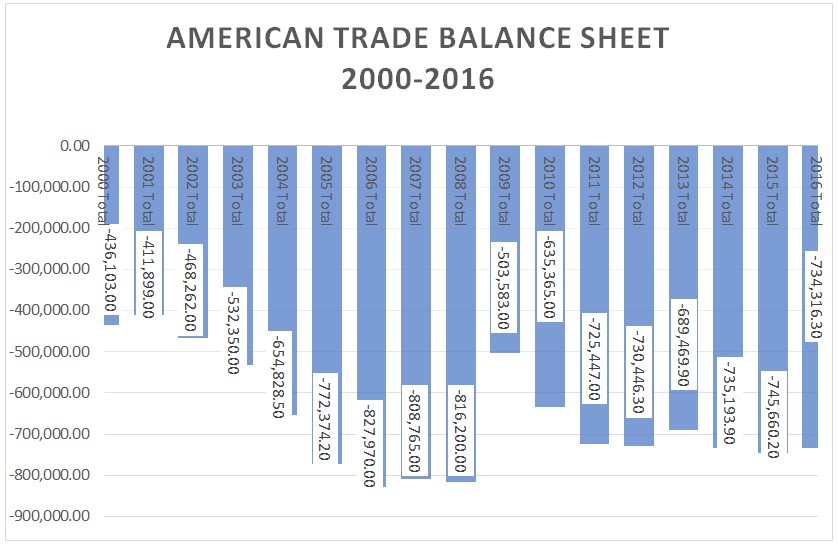
Because of this monetary response, there was a significant impact upon the US trade balance sheet. The significant drop in interest rates pushed already-concerned investment out of the economy, which caused deflation and the USD to fall. From this depreciation, exports increased to meet world demand, but imports were halted as the value of the dollar was small. These trade behaviours led to a significant reduction in the deficit in the year of 2009.
The UK too responded unprecedently, with a new plan of action –the British debut of quantitative easing (QE) introduced by the Bank of England in March of 2009, as traditional monetary methods were not as effective as hoped.
According to the OBR’s Economic outlook release in March of 2009, the injection of UK public funds to support the economy totalled £137 billion providing the banks with stability and trust amongst themselves. On top of this, the UK agreed to approximately £1trillion worth of financial guarantees to further the desired stability.
With regard to trade, again the UK followed suit. With significant reductions in the value of Sterling GBP (falling to as low as €1.04 on 26th December 2008), importing became more expensive and UK goods and services were internationally cheaper, leading to a reduction in the trading deficit.
Covid-19 response – The US
Coronavirus governmental response shadows that of the aforementioned figures. The US has gone to great financial lengths (regardless of initial promises) in attempt to keeps its economy afloat. First of all, the US interest rate has been lowered back to 2008 recovery levels of 0.25%.
Quantitative easing has been reintroduced to support the financial markets. The Fed initially outlined the purchase of at least $500 billion in Treasury securities and $200 billion in government-guaranteed mortgage-backed securities. As the virus continued to spread, the Fed’s stance changed slightly, as they announced an open-ended round of QE, stating they will “buy securities in the amounts needed to support smooth market functioning and effective transmission of monetary policy to broader financial conditions.”
Market conditions have since recovered, and slipped down once more. In response to this, the Fed denounced its tapering, and as markets began to suffer, then announced the purchase of $80bn a month. It is worth noting that, the fourth round of quantitative easing used as response to the crash of 2008 included the purchase of $85bn a month.
On top of this, the Fed has reintroduced the PDCF (Primary dealer credit facility), which provides 90-day loans with extremely low interest to 24 of the largest financial institutions in attempt to support credit in the economy.
Furthermore, the Fed has grown it’s repurchase agreement operations – known as repo. Repo markets include the borrowing and lending of extremely short term loans (often overnight) between banks and financial institutions.
According to Brookings, before Coronavirus the US Fed was offering $100bn in overnight repo and $20bn in 2-week repo. Post (or amidst) Coronavirus, this has now been expanded to offer $1trillion in daily overnight repo, alongside $500bn in one month, and a further $500bn in three-month repo.
The above are just a few of the monetary responses the US Federal reserve has taken to lessen the impact of COVID. However, joining the announcement of the rate cut, Jerome Powell Chair of the Fed, outlined the importance of fiscal stimulus alongside. A lecturer once described the use of monetary policy as “placing a lid on a barrel of snakes” – effective in the short term, but the snakes will get out eventually.
Congress and President Trump have since pledged at least $2trillion in fiscal stimulus – included direct stimulus cheques to eligible households – to support the fed’s actions.

“2020 could turn out to be the most significant single-year decline in economic activity since 1706” – Jonathan Haskel, UK Monetary Policy Committee
Covid-19 response – The UK
According to Professor Jonathan Haskel, external Member of the Monetary Policy Committee, the UK government have responded “accordingly”. Firstly, the Bank rate in the UK has been cut from 0.75% to 0.1% and the aforementioned QE has been expanded to include £200bn in March and a further £100bn in June.
The first round of asset purchases were designed to “prevent and stop” the financial market dysfunction resulting from the significant adjustment that occurred because of COVID.
Interest rate reductions and asset purchases are not the only methods used to aid this health crisis – the UK has also erected the CCFF (Covid Corporate Financing Facility) which lends directly to firms experiencing financial hardship caused by the virus. The CCFF has (as of 1st July) facilitated roughly £18bn in loans.
On top of these direct loans to businesses, the UK opened up the CJRS (Coronavirus Job Retention Scheme) on the 23rd March. As of the 1st July, this scheme had covered at least 80% of pay (up to £2,500 a month) for more than 9.3 million UK jobs – totalling £25.5bn in wage support so far, though the scheme is set to go on until October.
The total cost for the UK has grown exponentially as the virus has continued to spread. Pre-COVID, the UK was expecting to borrow roughly £160bn. Due to the need for government intervention however, in April alone £48.5bn was borrowed, and £55.2bn in May. The Office for Budget Responsibility has estimated a total yearly cost of £298bn for coronavirus related aid – be that asset purchases, furlough payments, bailouts or indeed direct loans.
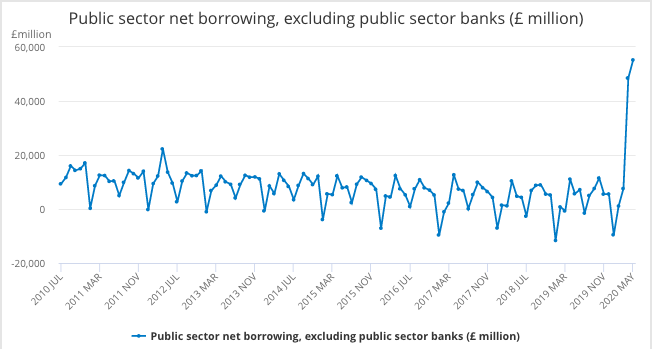
From a peak of £22,247 million borrowed in April of 2012, we can see a steady decline in the borrowing of the public sector, with January of 2019 being a 10-year record low (-£11,653m).
To give the above spike some context, we can see in April of 2019, public sector borrowing sat at £11,069m, in line with the overall fluctuated trend. Compare this with April 2020’s figure of £48,499m and we understand the true gravity of the situation.
More recently, the UK Chancellor of the exchequer Rishi Sunak announced a host of expansionary measures once again. This time, however, we saw the introduction of the ‘Eat out to Help out’ discount. As stated by Mr. Sunak, this is a unique time, and it calls for creative solutions. The EOTHO scheme will offer “Meals eaten at any participating business, Monday to Wednesday, will be 50% off, up to a maximum discount of £10 per head for everyone, including children.”
What is also interesting of the Chancellor’s announcement on the 8th July, is the reduction in VAT for hospitality and tourism sectors lowered from 20% to 5%. This is believed to be a “£4bn catalyst for the tourism and hospitality sectors”, benefiting around 150,000 businesses and 2.4m jobs around the country. This further reduces the governments revenue for the short term, in hope that long-term profits and indeed the survival of many of those businesses will pay back at a later date.
The true costs of borrowing
When it comes to governments obtaining funds, it is technically only borrowing when funds are raised from private institutions through gilts and bills as any money raised through a central bank is money added into the system (created cash/ credit – a controversial feat of fiat currencies).
Gilts are sold to investors through the Debt Management Office (DMO), and once purchased entitle the buyer to a payment of interest (coupon payment) every six months until the maturity of the gilt – which is when the original amount of the purchase is repaid by the government.
The aforementioned pre-COVID expected borrowing amount for the UK in 2020 of £160bn was decided upon to “finance the difference between its annual spend and tax receipts and pay back previous debt” – with the latter amounting to £100bn.
According to Britannica, “the only way the government will ever pay the interest on the debt or repay the principal is by levying taxes on the community.” This is where the methods of recuperation will have substantial effects on the economies in question.
National debts affect economies in different ways. It is imperative that whatever policies are put in place, are done so at the correct time. If national employment and economic activities are still suffering from the fallout of the virus, it would be of little value to increase taxes as the revenue would never actualise for the government.
This therefore requires government expenditure to get the economy in a place to repay the debt. If this is done in excess, the debt ratio of a country can cause other economic complications such as a drop in confidence and consequential reductions in foreign direct investment.
The dangers of excessive government expenditure alongside continued economic slowdown are illustrated well in the recent case of Greece. Officially spanning the 10 years between 2009 – 2019, the fiscal malpractice of the Greek government lead to government debt levels equal to 180% of GDP. According to the Council on Foreign Relations, it is estimated the Greek economy owes the EU and IMF €290m.
The maturity of state aid
Due to the massive amounts of debt accrued through the 2008 recovery, the budget deficit has been a hot topic for succeeding governments since. According to the Institute for Fiscal Studies, a combination of taxation increases, public spending cuts and other fiscal contractions have been used to consolidate the public debt.
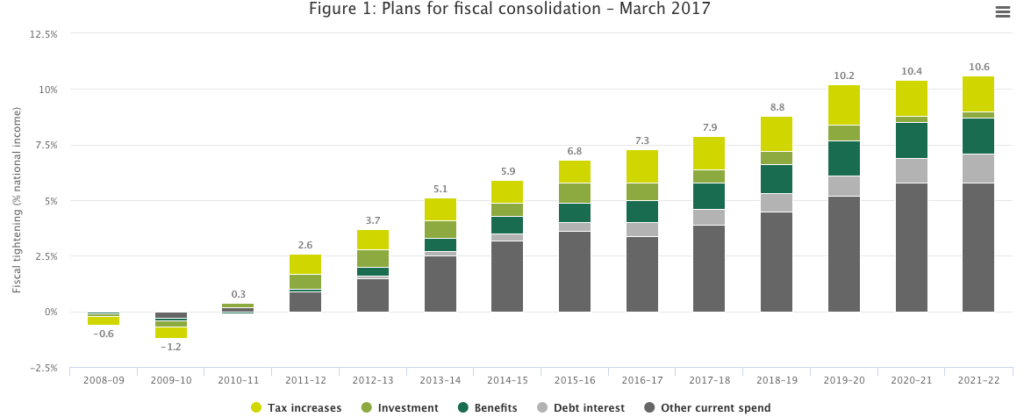
The reduction in public spending, widely recognised as Austerity in the UK has faced much criticism, but some form of alleviation of public debt was required following 2008.
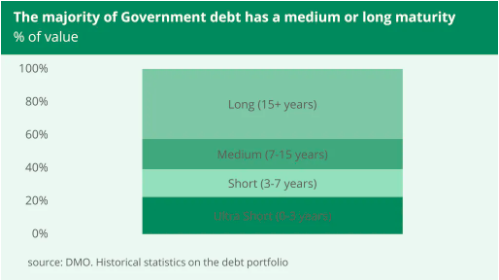
It becomes more alarming when looking at the above IFS graphic – taxes were already on track to be increased to cushion the pre-COVID debt levels. With the recent government aid announcements, this puts UK public debt back to concerning levels and will likely require even higher taxes, intensified austerity, or a longer period of governmental spending reductions – or indeed a combination of all three.