


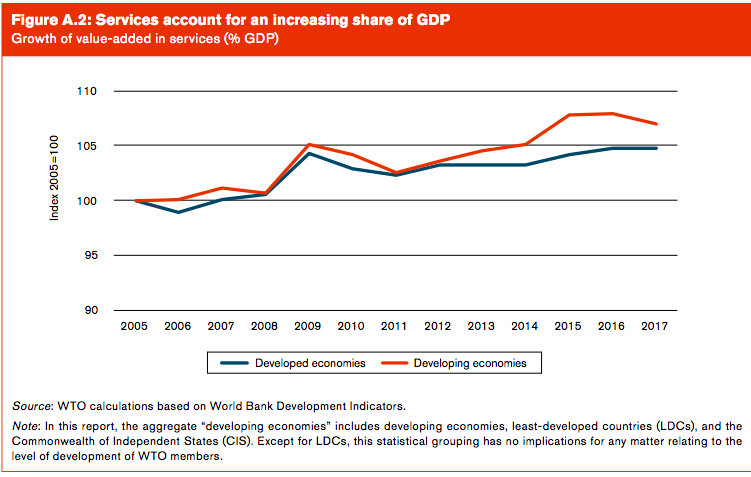
Across both developed and developing countries, services trade is accounting for a growing share of GDP. The World Trade Organization recently published their 2019 report “The Future of Services Trade”, which looks at this expansion of service trade and illustrates what the future of the sector may entail.
Their annual publication aims to “deepen understanding about trends in trade, trade policy issues and the multilateral trading system”, and that it has done. Prepared under the responsibility of Xiaozhun Yi, WTO Deputy Director-Generale and Robert Koopman, Director of the WTO Economic Research and Statistics Division, the incredibly detailed report looks into the trends of services trade over the past few decades; Exactly what has contributed to getting to where the international service trade platform is now; and what key variables will play a part in the future performance of the global service trade sector.
The report has produced many insightful findings, all of which paint a clearer picture of the current landscape the world trades services, and also where this market may be in the future. One such finding, is that If “commercial presence” (explored later) is accounted for, trade in services was worth approximately at US$13.3 trillion in 2017.
We at Trade Finance Global have summarised the some-200 page report into five key topics:
- Current Service Trade Environment
- Trade in Service Expansion
- Benefits of Services Trade
- Challenges of Services Trade
- Key Performance Drivers for Trade in Services in the Future


Current Service Trade Environment
Following the innovation and accessibility brought about by the innovation of digital technologies over the past 2 decades, service trade is now found to be a significant pillar in the strength and growth of a trading economy.
1995 saw the cultivation of the General Agreement on Trade In Services (GATS) – an agreed set of rules that are globally recognised which enable efficient communication and thus, increased service trade levels.
GATS include virtually all methods services can be traded internationally and incorporates them into a rule-based system which promotes transparency and predictability of the environment in which services firms are trading within.
Trade-in services was found to be of much higher significance than previously thought – accounting for $13 Trillion USD in 2017 when all modes of Service Trade were accounted for. This is approximately 20% of all global trade. Overall, roughly half of all services traded globally are a result of trade in goods, and the lines between the two are often blurred.
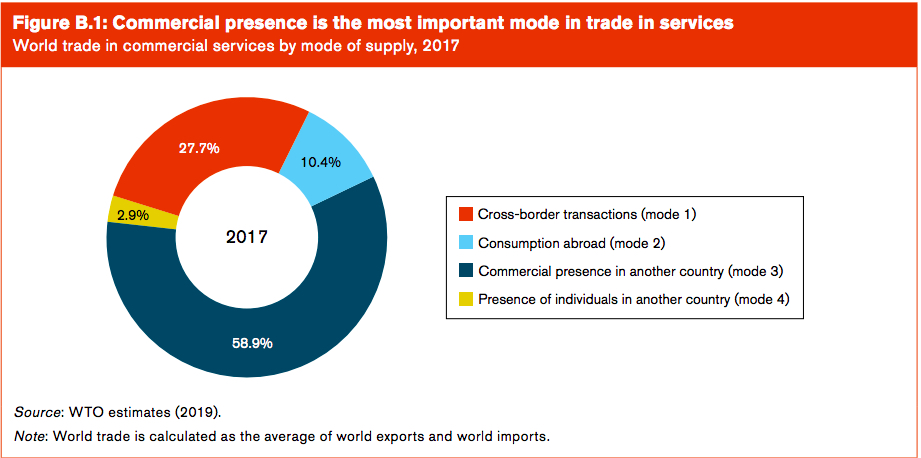
There are 4 main modes of services trade which are categorized by the WTO:
Mode 1) Cross-Border Supply:
Services are provided from one WTO member into the country of another WTO member through methods such as the internet.
Mode 2) Consumption Abroad:
The service is supplied in the country of one WTO member, and is open to consumption from (mostly) any other WTO member – such as tourism.
Mode 3) Commercial Presence:
Services through Commercial Presence are supplied by one WTO member country by means of having a physical affiliate in the destination country of another member country. An example of this would be a bank opening a branch in another member country.
Mode 4) The Presence of Natural Persons:
This method includes having persons – such as consultants etc. – situated in the destination country.
The WTO report found that mode 3 is the dominant method of service trade, with 2017 showing US$7.8 trillion worth of sales through the establishment of commercial presence – which translates to 58.9% of total global services trade.
Mode 1 is the runner up, totalling US$3.7 Trillion – 27.7% of total service trade. Mode 2 is third, accounting for U$1.4 trillion and 10.4% of service trade. Mode 4 – the presence of persons abroad accounted for just US$0.4 trillion – a 2.9% share of total global trade in services.
The report intelligently highlights that when services are traded through the commercial presence of an entity in another country, the comparative advantage offered and experienced is found on a firm level, rather than country. A firm that is successful in establishing itself in a foreign country, will subsequently use their own technology that was created in the home country, and will then match it with the destination economy.
Overall, the current climate for firms to be trading services is vastly different to even 2 decades ago. The number of services offered through the advancement of digital technologies has had a snowball effect on not only the volume of services trade, but also the way in which the services are traded. This has resulted in today’s overall global trade consisting of much higher shares of service trade.
The Expansion of Services Trade
One key finding from the WTO report is that Trade in Services has expanded faster than trade in goods since 2005 – 5.4% to 4.6% retrospectively. The “Services Revolution” is incorporated into the findings of the WTO, to accurately illustrate just how far service trade has come.
The United States, for example, found itself amongst many other countries that were drawn toward a service based economy. In 1950, service trade had accounted for only 43% of GDP. Fast forward to 1990, that share had risen to 61%, and 80% by 2019.
As mentioned, the US were not alone in this. India, who’s service trade contributed 30% of their total GDP in 1970, now have a 50% reliance on their services. Looking toward other economies, Japan’s services account for 68%, and New Zealand’s services account for 72%.
This shows substantial growth for the world of services trade. And although the advanced economies have benefitted from the progression of service trade, another significant finding of the WTO report is that developing countries are, in fact, experiencing service trade accounting for a higher percentage share of GDP.
Brazil’s service trade now accounts for 63% of their GDP, and China, once considered the manufacturing giant of the world have their services accounting for 52% of their GDP. Excluding LDC’s, developing countries added over 10% points in their share of global trade – US$3.4 Trillion world service exports and US$4.5 Trillion in global services exports.
What has driven the expansion?
Technology has played a major role in evolving the service trade landscape into what it is today. However, there are other factors that the report has highlighted well, such as regulatory policies, alongside a more cooperative structure between global economies for service trade.
An increasingly ‘open’ approach to services trade over the past three to four decades has also contributed greatly to the expansion of trade in services.
The benefits of a growing global service trade economy are monumental, and holds the potential to massively increase growth amongst not only services themselves but goods also, continue to drive costs down (such as communicational/ transportation) all the while creating the most transparent global network for people and economy’s resources, knowledge, skills and expertise.
The Benefits of Services Trade
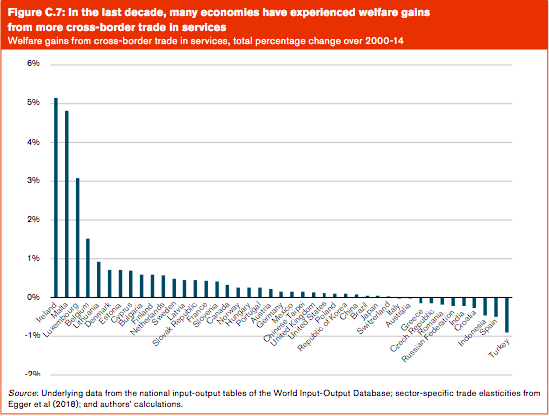
The crucial benefit of service trade is that it creates welfare gains for society, by enabling a more efficient allocation of resources, greater economies of scale and a wider variety of services available. The core economic problem faced by all economies is the battle of unlimited wants vs limited resources. A more efficient allocation of resources contributes toward a resolution – or at least a step forward.
The report produced a quantifiable measure of the welfare gains experienced through service trade. Between 2000 and 2014, one method used suggested trade in services resulted in an average increase of 6.3% in GDP per capita for some 148 economies.
Furthermore, the WTO found that service trade does a great deal toward improving firm’s competitiveness across both service and good sectors. They highlighted myriad academic papers which presented the ways in which competitiveness can be improved through trade in services. One study in particularly, Bourles et al, (2013) suggested four main channels in which service trade can improve a firms competitiveness:
- Availability of new services
- Expansion of existing services to areas that did not previously have access
- Improvements and innovation related to existing service that reduce costs
- A reduction in the market power of service providers as competition is increased, which then increases innovation leading to a better quality of service.
This was backed up by empirical findings from Bas (2014) who found that the ‘opening up’ of service trade in India resulted in a 6-8.5% increase in the likelihood of a manufacturing firm exporting.
The two are linked through the extensive use of services as inputs in the manufacturing process. Therefore, goods production is somewhat dependent on the quality and availability of the services that contribute toward them.
The World Trade Organization’s report also found that a large number of jobs are supported through the service trade sector. According to the OECD, the number of US Service related jobs increased by 40% from 2005-2015, suggesting high economic benefit for the wider economy. The US however, are not alone. Globally, the proportion of service related employment to overall employment is on the rise.
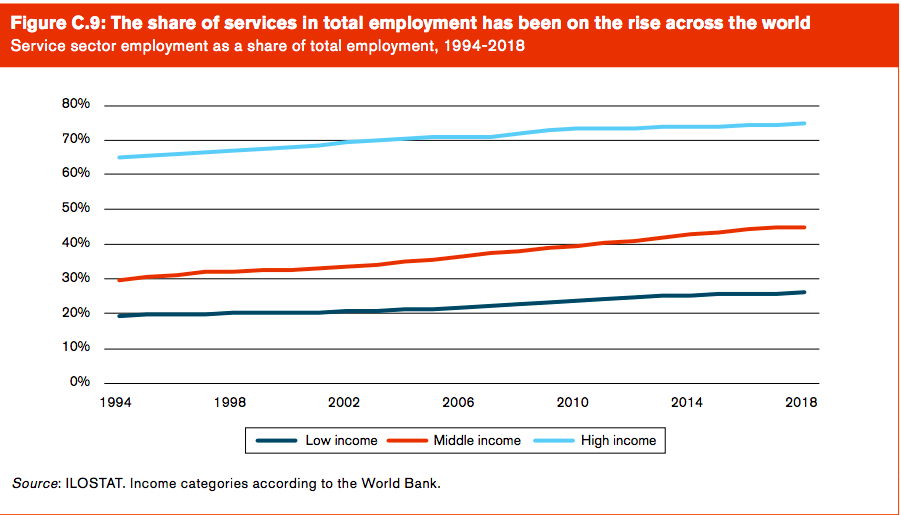
Factors such as the changing of demographics, technological innovation and rising incomes all attract people toward the service sector, and will continue to do so.

Challenges of Service Trade
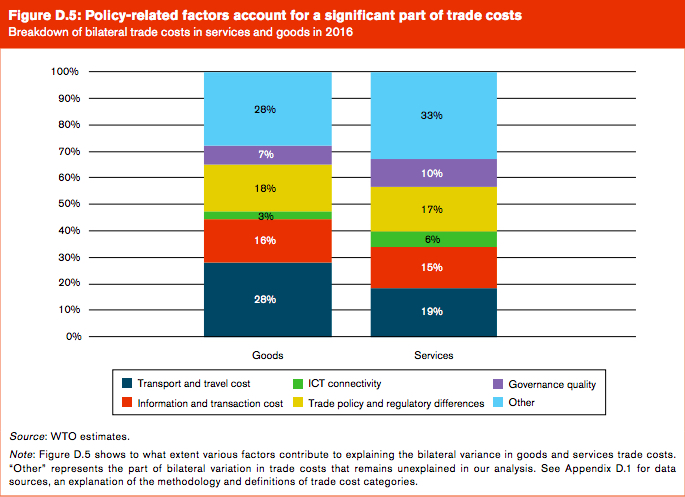
Among others, the annual report presented trade costs as being the most significant challenge to face service trade. It has been found that costs related to services are much higher than those relating to goods. However, the variance between these costs have been declining substantially as of late- between 2000 and 2017, the global services sector reported a cumulative decline in trade costs of around 9%.
The below is a detailed visual from the report that shows the composition of the aforementioned costs. It was found that, besides category ‘other’ (which remains unexplained) for services, transport and travel cost is rather significant, along with Trade Policy and Regulatory differences.
The performance of service trade was directly linked to the regulatory environment in which service firms operate. For example, the report highlighted a study by Bas and Causa (2013) which posed that If China were to improve their financial regulation to the average level found in OECD economies, their overall domestic economy would experience a 6.5% increase in manufacturing productivity.
According to Beverelli et al (2017), presented by the report, the institutional quality of an importing country impacts the extent to which services trade openness positively affects its manufacturing productivity.
There is also the issue of the “Proximity Burden”. A fact of services trade is, that unlike goods trade, often services require a close proximity between consumer and supplier. This makes sense when looking back to the dominance of service trade mode 3 – commercial presence. However, this ties in with the above institutional quality variable, in that if the quality of the importing economy is low, and the service provider would need to be commercially present in that economy, it may well choose against it therefore erecting barriers to service trade.
Key Performance Drivers for Trade in Services in the Future
The WTO stressed four major trends that will shape the future environment for global service firms to trade within. Digital Technologies, Demographic Changes, Rising incomes and the impact of Climate change.
These four trends are expected to enable new forms of services and methods of trading them, alongside affecting the demand and composition of said demand for service trade. Also, they are believed to create new markets and promote an even wider spread of service trade growth.
Digital Technologies
Being the main driving force behind much of the progression in service trade, it is to be expected that digital technologies will continue to be an engine behind growth in the sector. Mainly, the innovation of technologies benefits and advances service trade through supply and demand side gains. On the demand side, the consumers of a more digitally advanced economy are likely to have a wider choice and thus, purchase from a more competitive and efficient supply market. On the supply side, firms operating in a digitally increased economy are likely to encounter lower costs, again driving competition through the decrease in barriers to entry.
Thanks to digital innovation, many services that were only providable locally are now being supplied from all over the world. Many individual professions, such as consultants can operate in markets all over the world.
There is of course, Blockchain which, according to Catalini and Gans (2016) and the WTO report, will significantly reduce networking and verification costs even further, all the while reducing the associative costs of service trade such as transport, coordination, logistics etc.
Demographic Changes
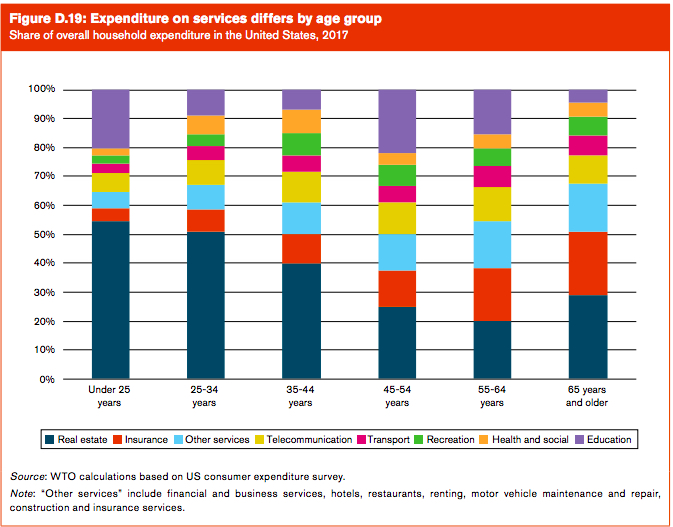
Demographic changes will likely have a grand impact on the way the world demands and consumes services. The world population is expected to reach 9.8billion by 2050, with developing countries moving toward younger economies and the opposite for developed countries. Ageing populations are believed to represent 27% of the population in developed countries, therefore drastically changing the needs, and thus demands for services.
The below is a visual from the report, which clearly shows the divide of household expenditure on services by age group. Using this, we can determine that an ageing population in developed countries will likely demand more healthcare services, whilst a growing young population in developing countries will demand more digital and educational services.
Rising Incomes
The gap in incomes between developed and developing countries is undeniable, however the report has currently pointed to a trend that has been in place since the turn of the millennia – the shrinking of the gap between GDP growth in advanced and emerging economies.
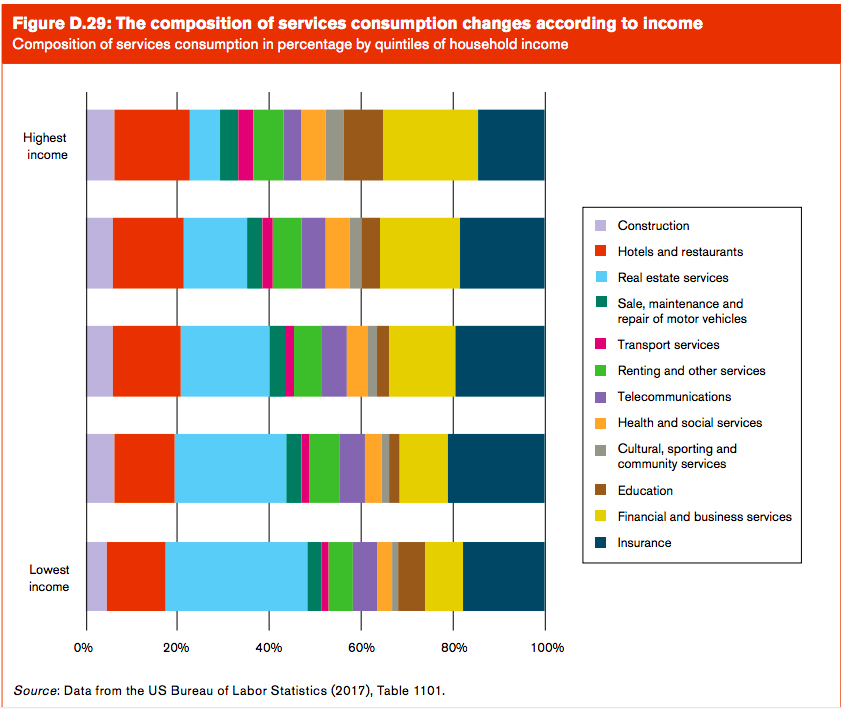
As income determines the composition of demand for goods and services, as these incomes increase we can expect to see the demand for services shift. An particularly interesting point of the report is what is behind these increases.
As incomes increase, the percentage share of services within an economies GDP is rising, and total employment increases. As countries become richer, the patterns of production and trade alter which in turn change the economies list of required skills.
Climate Change
The effect of climate change all around the globe has already had significant effects on the environment; rising sea levels, increased frequency and intensity of extreme weather conditions. Results of these changes are catastrophic, such as floods, droughts, forest fires and other natural disasters that our currently economic architecture cant support.
The report uses Toronto’s Pearson International Airport as an example. In January of 2018, hundreds of flights were cancelled because of the extreme winter conditions experienced. So there is the direct economic impact of those flights behind cancelled, but it is imperative to follow the trail of impacts. When barriers to communication and transport arise, the production and connectivity that has driven much of the ‘service revolution’ suffers.