- Access finance
- Case studies
-
Informing today's market
Financing tomorrow's trade
Soft commodities trader
Due to increased sales, a soft commodity trader required a receivables purchase facility for one of their large customers - purchased from Africa and sold to the US.
Metals trader
Purchasing commodities from Africa, the US, and Europe and selling to Europe, a metals trader required a receivables finance facility for a book of their receivables/customers.
Energy trading group
An energy group, selling mainly into Europe, desired a receivables purchase facility to discount names, where they had increased sales and concentration.
Clothing company
Rather than waiting 90 days until payment was made, the company wanted to pay suppliers on the day that the title to goods transferred to them, meaning it could expand its range of suppliers and receive supplier discounts.

Get Trade Finance
Informing Today’s Market, Financing tomorrow’s Trade.
-
- Case studies


Exporting to Egypt


Egypt Country Profile
Official Name (Local Language) Jumhuriyat Misr al-Arabiyah
Capital Cairo
Population 94,666,993
Currency Egyptian Pound
GDP $342.8 billion
Languages Arabic
Phone Dial In 20
Egypt Imports Profile
Imports ($m USD) 66,339
Number of Imports Products 4,139
Number of Imports Partners 173
Egypt Economic Statistics
Government Website | https://www.egypt.gov.eg/english/home.aspx |
| Sovereign Ratings | https://countryeconomy.com/ratings/egypt |
| Central Bank | Central Bank of Egypt |
| Currency USD Exchange Rate | 9.71 |
| Unemployment Rate | 13.1% |
| Population below poverty line | 25.2% |
| Inflation Rate | 12.1% |
| Prime Lending Rate | 9.75% |
| GDP | $342.8 billion |
| GDP Pro Capita (PPP) | $12,100 |
| Currency Name | Egyptian Pound |
| Currency Code | EGP |
| World Bank Classification | Lower Middle Income |
| Competitive Industrial Performance | 115/138 |
| Corruption Perceptions Index | 117/180 |
| Ease of Doing Business | 120/190 |
| Enabling Trade Index | 116/136 |
Access trade, receivables and supply chain finance
We assist companies to access trade and receivables finance through our relationships with 270+ banks, funds and alternative finance houses.
Get StartedExporting to Egypt
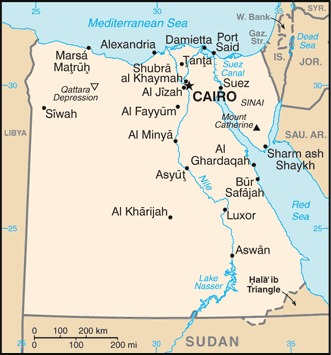
Egypt is one of Africa’s largest and most resilient economies, as well as an important trade partner for Southern Europe and the Middle East, with a solid trade deficit. Egypt’s main imports are oil, crops like wheat and corn, iron, and cars; its top import sources are China, Saudi Arabia, the UAE, and Turkey.
Egypt is one of the most important global trading hubs, with the Suez canal serving as one of the busiest maritime passages in the world. Attacks by the Houthi militia in the Red Sea have led crossings through the Suez canal to fall dramatically as ships are diverted to the Cape of Good Hope. Long delays and increased costs caused by this have led to rising prices, which could fuel a further rise in Egypt’s already high inflation and destabilise the domestic economy.
Exporting to Egypt can be cumbersome as bureaucracy is often slow and delayed further by corruption. The domestic economy is turbulent, with high rates of inflation, fast depreciation, and rising poverty and inequality; if this goes on, it could reduce domestic demand and decrease imports. However, the government’s monetary policy is having some success in stabilising the economy, and investment from the UAE among others will help boost demand, stabilising the import industry.
Exporting to Egypt: What is trade finance?
Although Egypt provides a variety of export commodities such as insulated wire ($ 1.1 billion), nitrogenous fertilizers ($1 billion), textiles and chemicals, the core of Egyptian economy is its oil export. Each day, the country produces around 600,000 barrels and exports about 155,000 of them. Crude petroleum comprises $6.70 billion, petroleum gas meanwhile takes a $2.3 billion part while refined petroleum comprises $1.1 billion of the country’s overall export. In the past, about 90% of Egypt’s exports is made up of cotton and cotton textiles continue to grow to 16% in the 1970s. However, cotton was replaced by oil and petroleum products by 1985.
Italy, the United States and India are the primary export destinations of Egyptian goods, which comprises 9.4%, 7.1% and 6.2% if the total volume, respectively. It is also notable to mention that some European countries such as Germany and Spain along with Asian nations such as China and Japan are also considered top exporting markets for Egyptian oil and other products.
Chart Showing GDP Growth Compared to rest of world
GDP Composition for Egypt
Agriculture
11.3%
Cotton, rice, corn, wheat, beans, fruits, vegetables; cattle, water buffalo, sheep, goats
Industry
35.8%
Textiles, food processing, tourism, chemicals, pharmaceuticals, hydrocarbons, construction, cement, metals, light manufactures
Services
80.9%
Map
Top 5 import Partners
| Country | Trade | % Partner Share |
| China | 8,105 | 12.22 |
| Germany | 4,515 | 6.81 |
| Italy | 4,192 | 6.32 |
| Saudi Arabia | 4,148 | 6.25 |
| United States | 3,897 | 5.87 |
Top 5 import Products
| Export Product | Number |
| Petroleum oils, etc, (excl. crude); preparation | 8.4% |
| Durum wheat | 5.3% |
| Natural gas, liquefied | 4% |
| Petroleum oils and oils obtained from bituminou | 3% |
| Maize (excl. seed) | 2.6% |


Local Partners

- All Topics
- Egypt Trade Resources
- Export Finance & ECA Topics
- Local Conferences