- Access Finance
- Case Studies
-
Informing today's market
Financing tomorrow's trade
Soft Commodities Trader
Due to increased sales, a soft commodity trader required a receivables purchase facility for one of their large customers - purchased from Africa and sold to the US.
Metals Trader
Purchasing commodities from Africa, the US, and Europe and selling to Europe, a metals trader required a receivables finance facility for a book of their receivables/customers.
Energy Trading Group
An energy group, selling mainly into Europe, desired a receivables purchase facility to discount names, where they had increased sales and concentration.
Clothing company
Rather than waiting 90 days until payment was made, the company wanted to pay suppliers on the day that the title to goods transferred to them, meaning it could expand its range of suppliers and receive supplier discounts.

Get Trade Finance
Informing Today’s Market, Financing tomorrow’s Trade.
-
- Case Studies


Importing from South Africa

South Africa Country Profile
Official Name (Local Language) The Republic of South Africa
Capital Pretoria
Population 54,300,704
Currency South African Rand
GDP $280.4 billion
Languages Afrikaans
Phone Dial In 27
South Africa Exports Profile
Exports ($m USD) 88,268
Number of Export Products 4,461
Number of Export Partners 223
South Africa Economic Statistics
Government Website | https://www.gov.za/ |
| Sovereign Ratings | https://countryeconomy.com/ratings/south-africa |
| Central Bank | South African Reserve Bank |
| Currency USD Exchange Rate | 15.7 |
| Unemployment Rate | 26.8% |
| Population below poverty line | 16.6% |
| Inflation Rate | 6.5% |
| Prime Lending Rate | 5.75% |
| GDP | $280.4 billion |
| GDP Pro Capita (PPP) | $13,500 |
| Currency Name | South African Rand |
| Currency Code | ZAR |
| World Bank Classification | Upper Middle Income |
| Competitive Industrial Performance | 47/138 |
| Corruption Perceptions Index | 71/180 |
| Ease of Doing Business | 82/190 |
| Enabling Trade Index | 55/136 |

Access trade, receivables and supply chain finance
We assist companies to access trade and receivables finance through our relationships with 270+ banks, funds and alternative finance houses.
Get StartedImporting from South Africa
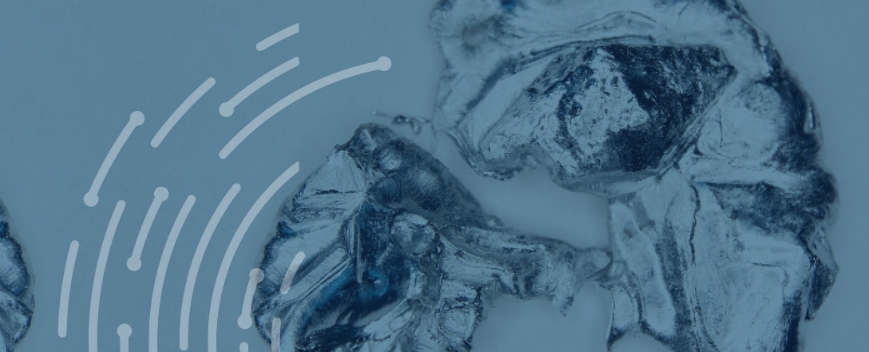
South Africa is Africa’s biggest economy and a major exporter of precious metal, producing almost 75% of the world’s platinum, as well as much of its chrome, manganese, and vanadium. It also has a thriving agricultural industry, being the world’s second largest exporter of citrus fruits, where it competes with Spain. South Africa is an important trade hub, with the largest container terminal in the Southern Hemisphere and 2 of Africa’s 5 busiest harbours all on the South African coastline. It is both a significant importer and exporter, and has a small but consistent positive trade balance.
South Africa is one of the most unequal countries in the world, with over half the population living under the poverty line despite its relatively high GDP and persistently high unemployment. This leaves it vulnerable to frequent unrest and corruption, as well as social problems like homelessness and organised crime. Elections in May 2024 saw the ANC, which had been the majority party since the end of Apartheid in 1994, lose its majority and enter into a coalition with a smaller liberal party. Under this coalition, fiscal tightening is expected, which is likely to lead to dissent both inside the government from opposition parties and from the population, which could cause unrest, protests and strikes. If these turn violent, they could lead to a disruption in supply chains and have a significant impact on trade, especially in agricultural products and other perishable goods. Investor sentiment, which could be bolstered by the coalition’s reforms, may be worsened by the increase of organised crime activities like kidnappings and robberies.
South African infrastructure is a significant issue for the economy: its railway system has all but collapsed, leading goods to be transported by trucks on run-down roads, and its harbours have been consistently scored last in global rankings. The energy system is also close to collapsing, with frequent power cuts termed “load shedding” leaving the country without electricity for over half the time. This forces businesses to use expensive generators, which increases running costs and reduces productivity. South Africa is a member of the African Continental Free Trade Agreement, into effect since January 2024, which allows free trade from signatories and is expected to bolster intra-African trade and international investment. The new government, which excludes left-wing parties and has promised investments in energy generation, might increase foreign confidence, but the high level of unrest and volatility are likely to be a challenge for trade and investment.
Importing from South Africa: What is trade finance?
South Africa ranks as the thirty-sixth largest export economy in the world and the fourty-fifth most complex economy as rated by the Economic Complexity Index (ECI). South Africa exports around $110B and imports around $108B a year, which results in a small positive trade balance of around $2B. The GDP of South Africa is around $360B and the GDP per capita is around $12k. Imports into South Africa averaged around 14500 ZAR Million from around 1957 until 2015, which reached a height of around 110000 ZAR Million at the end of 2014 with a record low of around 65 ZAR Million at the end of 1961.
The main imports are crude petroleum (around $14B), cars (over $5B), gold ($5.5B) and computers ($2.2B). The main origins of import are China (around $16B), Germany (over $9B), Saudi Arabia (over $8B), the United States (over $6.5B) and India (around $5.3B). The main South African imports are fuel (around 25%), boilers, nuclear reactors, machinery (around 15%), vehicle parts (around 10%), telephone sets (around 3%), pharmaceuticals (2%), and vegetables (2%)
Chart Showing GDP Growth Compared to rest of world
GDP Composition for South Africa
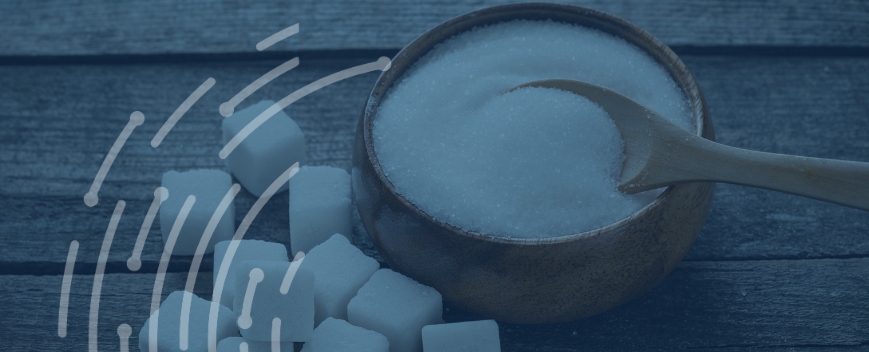
Agriculture
2.2%
Corn, wheat, sugarcane, fruits, vegetables; beef, poultry, mutton, wool, dairy products
Industry
29.2%
Mining: platinum, gold, chromium; automobile assembly, metalworking, machinery, textiles, iron and steel, chemicals, fertilizer, foodstuffs, commercial ship repair
Services
68.7%
Travel Transportation Other business services Financial services Computer and information services Government services Cultural and recreational services Royalties and license fees Construction services
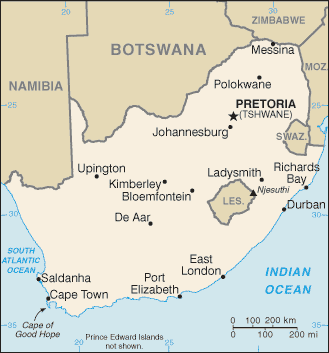
Map
Top 5 Exports Partners
| Country | Trade | % Partner Share |
| China | 8,666 | 9.82 |
| United States | 6,620 | 7.50 |
| Germany | 5,810 | 6.58 |
| Unspecified | 5,465 | 6.19 |
| Japan | 4,162 | 4.72 |
Top 5 Exports Products
| Export Product | Number |
| Bituminous coal, not agglomerated | 7.5% |
| Gold in oth semi-manufactured forms,non-monetar | 6.5% |
| Multi-ply paper and paperboard, coated… | 6.4% |
| Ferro-chromium containing by weight more than 4 | 5.6% |
| Diesel powered trucks with a GVW not exceeding | 5.4% |


Local Partners
- All Topics
- South Africa Trade Resources
- Export Finance and ECA Topics
- Local Conferences