


“WTO economists believe the decline will likely exceed the trade slump brought on by the global financial crisis of 2008-2009”

In their latest release on 8th April, the World Trade Organisation announced they expect World Trade to fall by significant numbers – possibly exceeding that of the 2008 financial crisis – and also shed light on how long it may be before the World economy recovers from Covid-19.
Heading into 2020
“Global merchandise trade stalled in 2019 under the wright of persistent trade tensions, with trade turning down toward the end of the year”
The release correctly points to the difficulties faced by global economies throughout 2019, owed to rising political tensions. The World Economic Forum released a stern warning to the world in January 2019, in their publication “Four Scenarios for the Future of Trade and Investment” that assed such tensions, and summarised four avenues the global trading economy could take as the year went on. TFG reported on their follow up release in January of 2020, which presented economic findings proving one of the four aforementioned avenues correct.
Much of the political unrest experienced in 2019 and even coming into 2020 can be put down to the decline of multilateralism in the global economy, which played a major part in the world’s economic growth of the past 70 years or so. In the below graph presented by the WTO, we can see an index of, and percentage change in year-on-year global merchandise trade from Q12015 – Q42019.
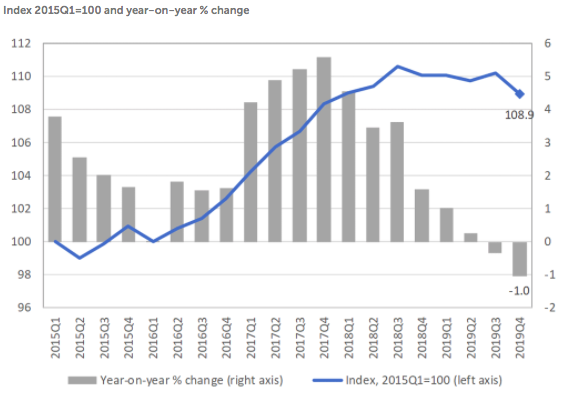
- Figure 1: Global merchandise trade volumes, YOY % change, WTO
Above, we see a substantial reduction in global merchandise trade volumes. From a peak of approximately 5.5% year-on-year growth in trading volume at the end of 2017, Q1 of 2019 showed a 1% increase from the same period 2018. By Q4 of 2019, this was down to -1%, suggesting a significant contraction in the global economy.
Looking at the International Monetary Fund’s October Economic outlook, we can see the reduction in real GDP growth by emerging economies (red), advanced economies (blue) and the world platform (yellow). This shows significant decline, which further illustrates the true difficulty the world economy was facing coming into 2019, without the presence of Covid-19.
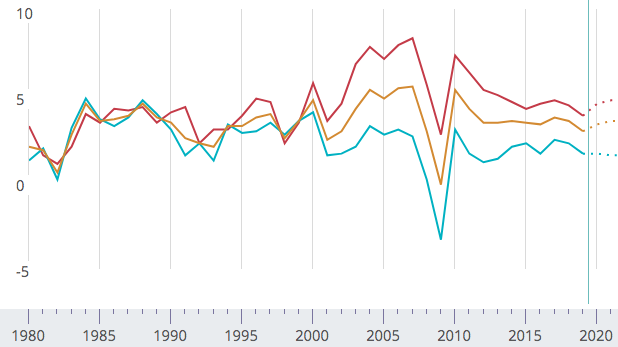
- Figure 2: Global Real GDP growth 1980-2019, IMF
By assessing the performance of the world’s two largest economies, the above illustration of the overall decline in world real GDP growth is a little clearer.
According to the National Statistics Bureau of China, they reported GDP of 99,086.5 billion yuan in 2019 – a 6.1% increase on their previous year’s figures. Looking at the world’s second largest economy’s GDP growth over the past 40 years or so, we see that a growth percentage of 6.1% is actually the lowest growth the country has seen since 1989-1990 where GDP growth was 3.9% (figure 3). This was to be expected at some point, as the growth China produced over the past 3-4 decades has been unprecedented and many believe unsustainable. It was therefore expected to slow, however the geo-political tensions mentioned previously sped this up significantly.
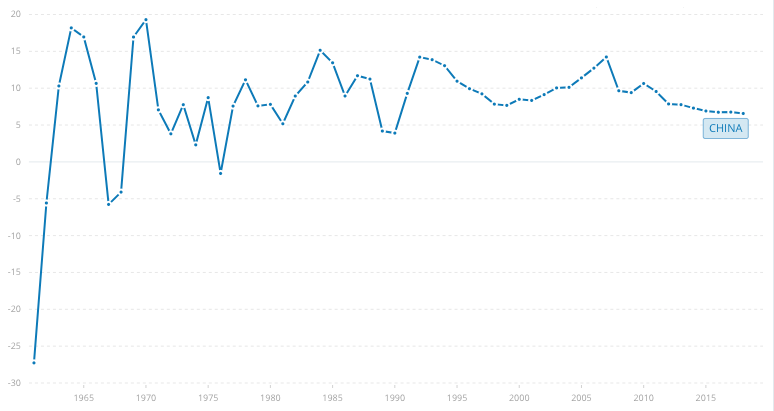
- Figure 3 – Chinese GDP Growth, World Bank
Much of the above decline can be attributed to the infamous trade war with the US, in which hundreds of billions worth of tariffs were applied between both participating economies. This war had significant implications on the US economy as well. US GDP growth fell to 2.1% in Q4 of 2019, however the US suffered more in GDP terms at the end of 2018, when the Trade War had started to accelerate with GDP growth levels falling to 1.1%.
A Tough Year Ahead
“These numbers are ugly – there is no getting around that. But a rapid, vigorous rebound is possible.” – WTO Director-General Roberto Azevêdo
The WTO’s release points to the devastating disruption that Covid-19 has, and continues to cause to the global trading platform. In the below graph, we see world merchandise trade volumes, with optimistic (green) and pessimistic (red) scenarios, along with previously expected trend lines. The visual presents the stark reality that the crisis we are currently in the midst of could indeed shadow that of the 2008 financial crisis.
The optimistic scenario, shows global merchandise trading volumes fall to an index of 95 – an approximate -12.8% reduction from the already-damaged Q4 2019 index. This is a 20 index point, or a -17% variation from the 2011-2018 trend line. Under this optimistic scenario, the WTO assumes that a strong recovery will bring merchandise trade volumes roughly back to the trend line at the end of 2020.
Under the pessimistic scenario, we can see global merchandise trading volumes fall to an index of 76 – an approximate -30.2% reduction from the Q4 2019 Index point. Against the 2011-2018 trend line, this scenario represents a 39 index point, or -33.9% variation from the trend line.
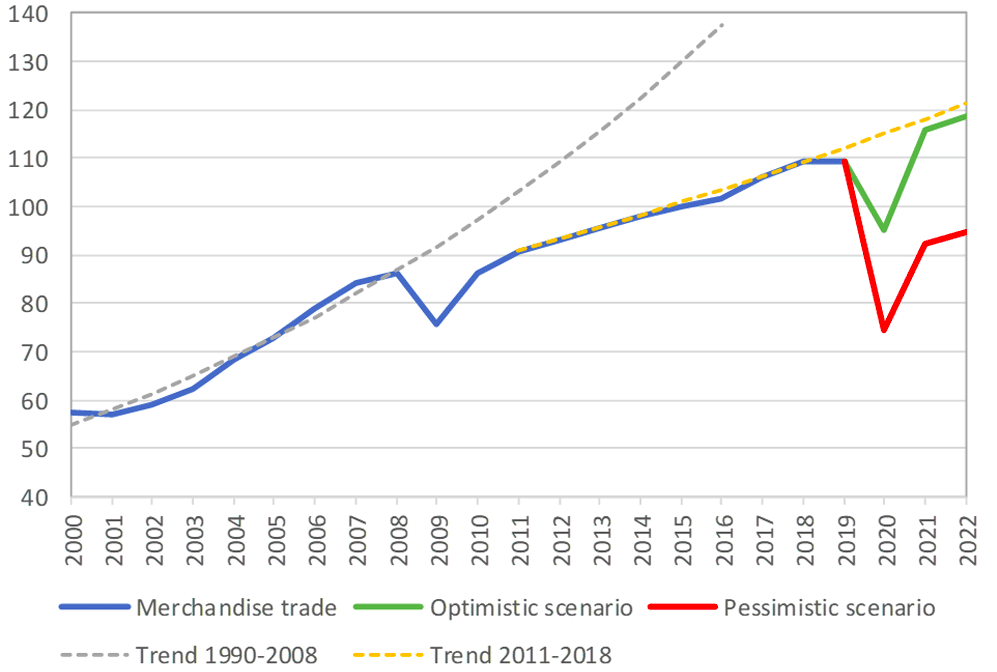
- Figure 4 – World Merchandise Trade volumes 2000-2022, WTO.
We can see the depth of the contraction in global goods trading under the pessimistic scenario is ever so slightly below that of the 2008-2009 financial crisis. The true concern extracted from this visual is not so much the depth of the fall, rather the trajectory of the recovery. As explained by the WTO, trading volumes never returned to the trend line following the 2008 crisis. The trend line for 2008 ends 2016, at an index of roughly 139. Instead, in 2016 global trading volumes sat at an index of 100. A near 40 index point variation, or -28%.
With the optimistic scenario, we see volumes return to the trend line we were on pre-pandemic. The pessimistic scenario however, seems to follow suit of 2008 onward trading volumes, failing to return to previous trends. The trend line for 2011-2018 ends in 2022 with an index of around 120, where the pessimistic scenario finishes around 95 – a -20.8% variation.
Much like the recovery out of the crisis, the rate at which the global economy entered this crisis – a health crisis, as pointed out by Director-General in the release – is of much more concern than the depth itself.
This is echoed by the Purchasing Managers Index – a diffusion index believed to quantify economic trends and market conditions to indicate the movement of the economy.
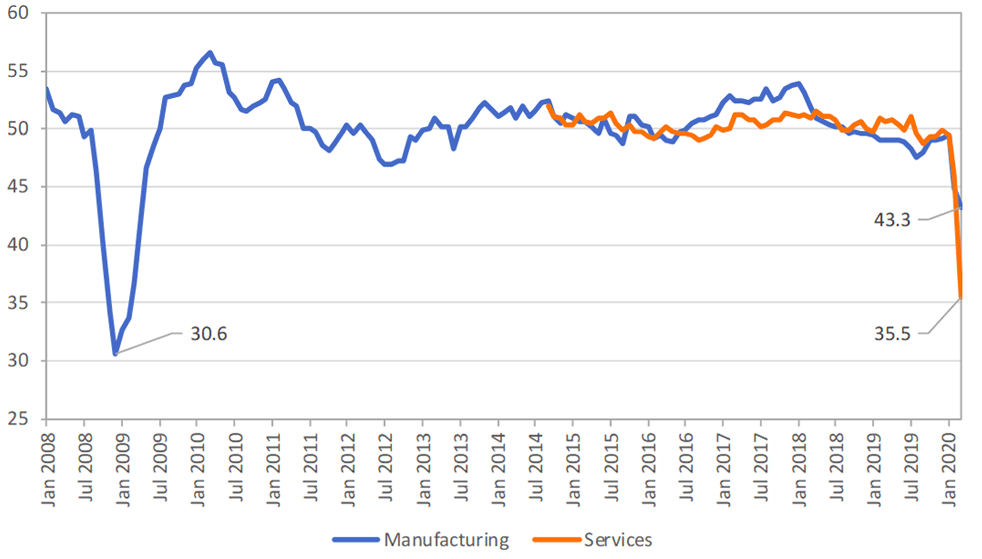
A score of above 50 indicates expansion in an economy, and a score of below 50 indicates contraction. In the above graph included in the WTO release which shows the global PMI for export orders, we see the merchandise index fall from a pre-pandemic score of approximately 49, to 43.3 and the services index fall even deeper to 35.5 from the same start point.
By looking at the United Kingdom’s overall PMI specifically, we see a clearer picture of the risk to global economic performance posed by Covid-19.
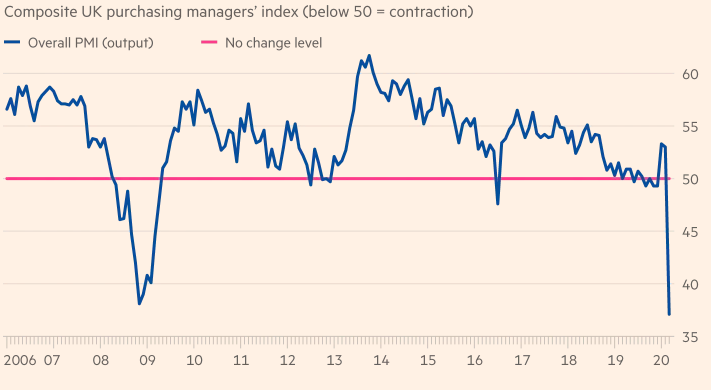
- Figure 6: UK Purchasing Managers Index, Financial Times
In the UK’s overall PMI graph, we can see economic indicators pointing toward a substantial reduction in business activity, actually to a deeper extent than that of the 2008 crash.
However, it is the steepness of that decline which has been the root of economic suffering. At the start of 2008, the UK PMI sat at around 54 – indicating (albeit less than a year previous) growth in the economy. By late 2008, this had fallen by -29.6% to an index of 38 – averaging -1.3 index points per month.
Looking at 2020, we can see the UK started the year at an approximate index of 53 and ended February at an index of 37 – a -30.1% reduction over 2 months – averaging -8 index points per month.
This is daunting, yet realistic. In 2008, it was a financial crisis that, although affected economies all over the world with significant stimuli required, was limited in its reach (compared to Covid-19). The affect businesses within the same sector – say retail, for example – may have felt the crash differently, and was dependent on their financial ties/ liabilities. This time around, however, it is the majority of all businesses. Governmental ‘lock-downs’ have forced businesses, and entire industries to close their doors to prevent the spread of the disease. It therefore does not matter in this crisis the type of mortgage you own, or how affected your target market was individually by the crash – everyone is in the same, sinking boat.
Although logical, the steep decline in business activity within the UK, and the entire economy is concerning, and also indicative of just how long it may take global economies to recover – and also how well.
Supply Chains and Services
“Services Trade may be the component of World Trade most directly affected by Covid-19”
The WTO’s publication also correctly identifies the significance of supply chains and service trade in the distinction between the 2008 crash and today’s crisis. As a global leader in manufacturing, the global economy has become somewhat dependent on Chinese production. In 2019, China exported $418 bn to the US, $79 bn to Germany, $62 bn to the UK and so on.
Because of this dependence, even when Covid-19 was isolated in China the restrictions put in place by the Chinese Government were already disrupting global supply chains, with factories shutting due to social distancing etc. According to data published by China’s General Administration of Custom’s, the economy experienced a -17.2% decline in exports year-on-year for the first two months of 2020.
Due to the scale and speed to which sectors are having to close all around the world (hospitality, retail etc), services trade is expected to be hit the worst. Moreover, the WTO points to the fact that “unlike goods, there are no inventories of services to be drawn down today and restocked at a later stage”. This means service trade lost today may never be recovered.
There is a silver lining, as faint as it may be, and that is the IT service industry. As highlighted by the publication, the pace of the development of Covid-19 led many companies into a manic rush to mobilize their workforce with little preparation time. This has led to a substantial increase in the demand for IT services. Zoom Video Communications (ZM) is a prime example of this. As corporations turn the majority of their operations mobile, virtual meetings have become a necessity. This, along with individuals using video communication technologies to stay in touch with family and friends have resulted in a considerable surge in the use of said technologies, and their market price.
Below is the market price chart for Zoom. We can see that at the beginning of 2020, it was priced at 67.280. By March 23rd, this had increased 137.1% to 159.560. It has since fallen to 124.51, however this is still an 85% increase on their starting price in January 2020.
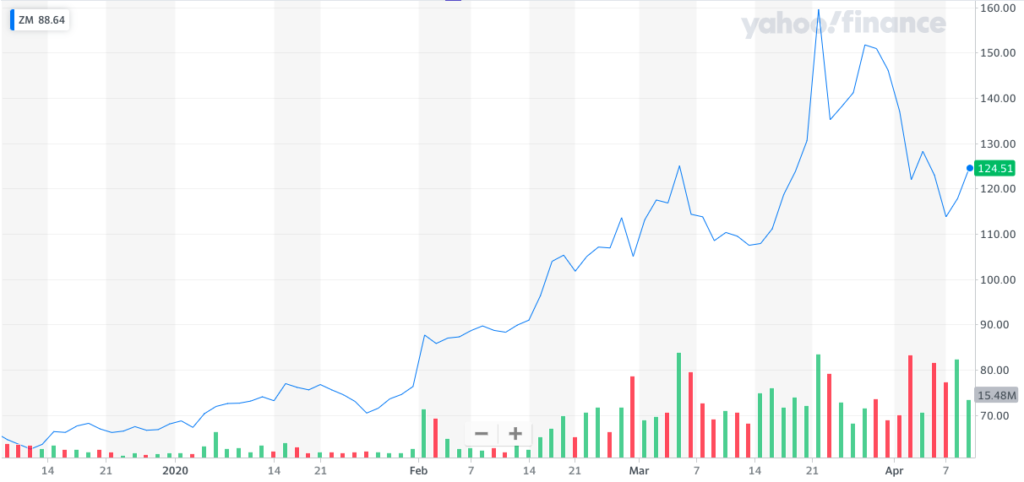
- Figure 7: Zoom Technologies (ZM) – YahooFinance
Recovery
“A 2021 recovery in trade is expected, but dependent on the duration of the outbreak and the effectiveness of the policy responses”
Recovery is a difficult word to define in times such as these. As explored above, what shape this will take over the coming months (perhaps years) may be radically different to previous expectations. Just as governmental restrictions have impacted the way businesses conduct themselves, and indeed interact with one another, they will lay the foundations of the world’s economic recovery. As Director-General said “decisions taken now will determine the future shape of the recovery and global growth prospects”.
Should the virus continue to spread, and depressed business activity along with deflated trading volumes continue, the impact will continue to cause mass disruption on global businesses. The effectiveness of policies currently in place, along with people’s adherence to them, will define the duration of this pandemic which in turn, will decide how and when we recover.