


The ‘what happens after Brexit’ question has never been answered. It was studiously avoided during the referendum campaign, not least because the ‘leave’ vote needed support from both those who wanted freer trade and those who wanted more restrictions. And since the referendum the government has talked about ‘Global Britain’ without properly defining it.

The Department of International Trade has done a sterling job negotiating 30 new trade agreements, but by their own admission, these are just ‘to reproduce the effects of trading agreements that previously applied to [the UK]’. That continuity agenda is now complete, and we need to decide what is next.
Trade policy has many dimensions; here I want to focus just on geography. Classical trade theory says ‘don’t ask’ – buy from the cheapest source and sell to any market that is profitable. But it is more complicated than that because governments can support traders, influence what firms produce, and sign trade agreements. And the last can have wide-reaching ramifications because they involve agreeing to norms and constraints on policies. Hence it makes sense to ask where the UK should trade as well as where it will.
“The ‘leave’ vote needed support from both those who wanted freer trade and those who wanted more restrictions.”
Figure 1 summarises UK trade patterns. For exports or imports of either goods or services, Europe is the dominant partner, with 50–60 percent shares in each case. Of these high numbers, the vast bulk is trade with the European Union. The Americas, largely the USA, take around 20 percent of UK exports of goods and, by 2019, 30 percent of exports of services, but provide smaller shares of imports. In Asia, there are several important, but no dominant, partners; together they have growing shares with the exception of exports of services, which has remained mired at around 15 percent for two decades.
Figure 1: Partner shares of UK trade 1999-2019
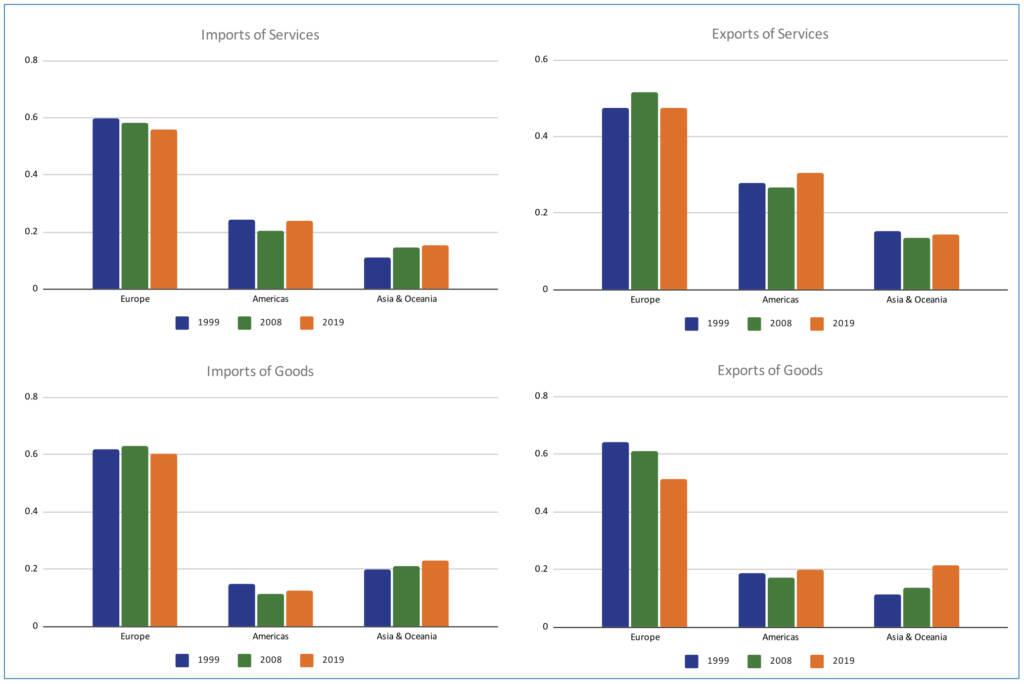
The declining trade shares with the EU and booming shares with Asia, especially in exports of goods, lead some to say: ‘thank goodness we’re free of the EU’. But the story is more nuanced than that. First, why is Europe so dominant? UK membership of the EU has clearly helped. With its zero tariffs and substantial alignment in regulations and standards, the EU has done a great deal more to stimulate intra-EU trade than trade with the rest of the world – think agriculture and motor vehicles or professional and audio-visual services. But, in fact, Europe is large, rich, similar in outlook and, above all, close to the UK, so it will always be the UK’s main partner.
Distance still matters: recent research suggests that if one partner is twice as far away as another, it will have, on average, 50 percent less trade with you in agriculture, 45 percent less in manufactures and 40 percent less in services. An average UK export or import with the Americas travels an average seven times further than one with Europe. With Asia, this is nine times further. If everything else were the same, trade with the Americas would be only 13%, 20% and 25% of the level with Europe in agriculture, manufactures, and services respectively; and with Asia 10%, 14% and 21%.
As it is, both are larger economically than Europe, and growing faster. In fact, those differences in growth rates almost fully explain the changes in goods shares in figure 1. Between 1999 and 2019, UK exports to the three regions grew at about the same rate as those regions’ total imports, while UK imports from them grew at about the same rate as their total exports.
It certainly is sensible to try to increase the UK share of the dynamic Asian markets. Unfortunately, however, that is easier said than done. First, recent evidence shows that distance not only cuts the level of trade, but also significantly reduces the effectiveness of trade agreements in increasing it.
Second, unlike Europe and the Americas, Asia does not have a predominant individual partner. China is the largest, accounting for a bit less than half of Asia’s trade with the UK, followed by Japan, which is perhaps a quarter of the size. Liberalising Asia’s trade effectively will therefore require quite a few trade agreements, and when you think of who will have to sign them, things look daunting. India cannot bring itself to sign any effectively liberalising agreement; China can, but on its own terms (which means good access for its manufactures in the UK) but comes with a full gamut of geopolitical headaches.
Figure 2: Exports of Goods and Services, 1999-2019
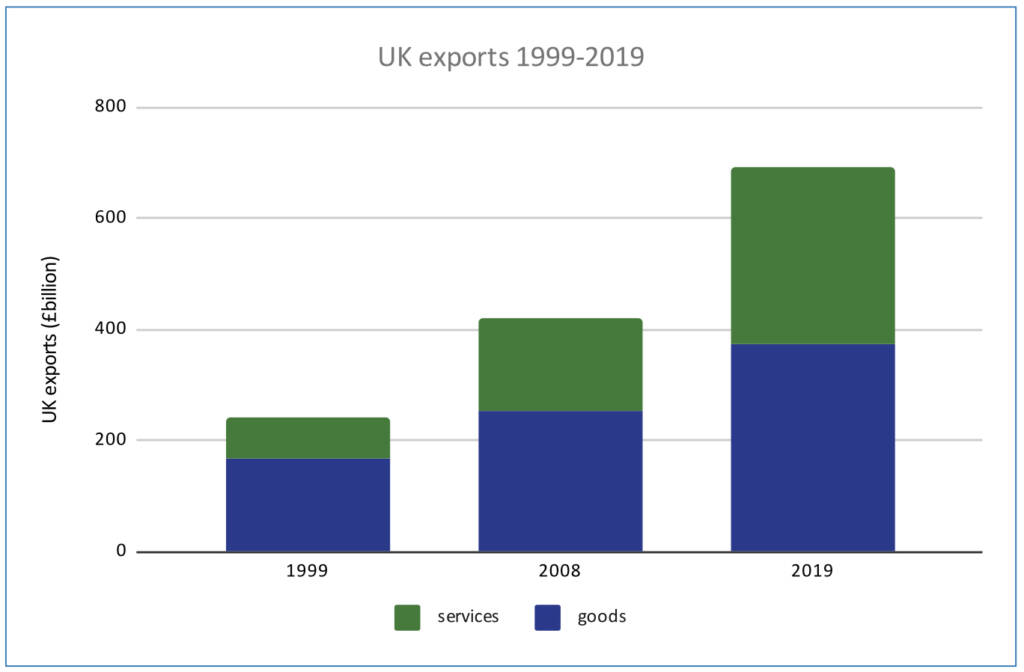
Third, UK trade is pivoting rapidly towards services, see figure 2. Services now account for 46 percent of UK total exports, by far the highest proportion among major economies. If you refer back to Figure 1; however, you will see that in services Asia’s share of UK exports has been static for 20 years. Doubtless Asian economies will increase demand for services as they grow in future. This is what the UK government must target, although their woeful treatment of services in the Trade and Cooperation Agreement with the EU is not a good omen.
The data suggest two priorities for UK trade policy over the next decade. The first, limiting the damage of the withdrawal from Europe, by seeking to ease trade frictions and extend the recent trade agreement; Europe will always be our main market and the returns to agreements with closer countries are higher. The second: the Asian services market.