


International tax competition (ITC) stems from governments encouraging inflows and discouraging outflows of capital within their country, typically through corporation tax rate (CTR) reductions to increase the attractiveness of foreign direct investment (FDI) (Mitu, 2009).
ITC decreases tax revenues, public spending, and welfare; hence the European Union (EU) introduced various ITC limiting initiatives. However, on June 23rd 2016, the United Kingdom (UK) voted for Brexit; withdrawal from the EU. Brexit may break-down the initiatives that limit UK-EU ITC, sparking a new round of ITC. Varied perspectives exist regarding the potential impact of Brexit on ITC; this article considers such positions to conclude an overall judgement.
The Development of ITC and CTR Coordination
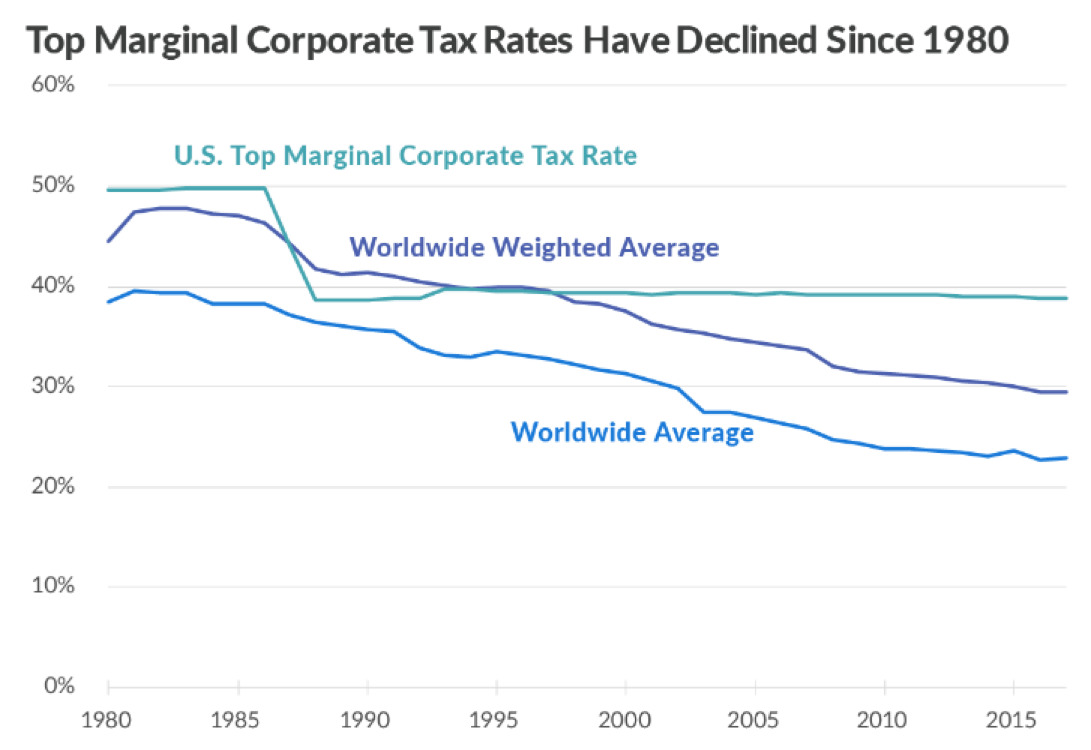
In the 1980’s, technological development increased capital mobility, triggering government CTR reductions to attract mobile capital (FDI), igniting ITC (Hines, 2007). Figure 1 illustrates worldwide average CTRs decreasing from 38% to 23% between 1980-2015.
Figure 1
Corporate Tax Rate Time Series 1980-2015
ITC causes inefficiently low CTRs, erodes tax revenue, public spending, and welfare (Zodrow, 2003). To limit ITC between Member States, the EU introduced initiatives, including the 1997 Code of Conduct, the 2003 EU Savings Directive, and the Common Consolidated Corporate Tax Base (European Commission A; European Commission B). Although such initiatives’ success is debatable, the EU remains the only international organisation tackling ITC with some degree of success (Haupt, 2017).
If post-Brexit agreements replicate current EU free-trade agreements, ITC will not occur. However, with an uncertain post-Brexit UK-EU trade deal, Brexit potentially breaks down the EU initiatives that limit ITC, sparking a new round of UK-EU ITC (Trade Finance Global, 2016).
Brexit: Potential Negative Impact for the UK
One perspective is that Brexit will harm FDI attractiveness for the UK, reducing capital inflows, economic growth, and citizen welfare (Brakman et al, 2017).
EU membership increases a country’s FDI by a 28% average; in 2015, approximately 45% of UK’s £1 trillion FDI originated from the EU, with FDI creating 75,000 jobs between 2016-2017. The UK’s most important export market is the EU single market. Supposing a UK-EU post-Brexit trade deal fails to replicate current free-trade agreements, and the UK no longer has access to the single market, estimates suggest Brexit could reduce the UK’s £1 trillion FDI stock by 22% (Osborne, 2016). This may result from several factors:
- The EU single market attracts FDI through creating an export platform, with no exporting barriers. Brexit removes this structural platform for UK-based businesses, reducing FDI attractiveness, encouraging UK business relocation to the EU, thus decreasing UK capital stock and FDI.
- Many multinational companies within the UK have complex EU supply chains; potential post-Brexit UK-EU trade regulation changes may increase operational costs. FDI attractiveness into the UK decreases, triggering a capital outflow and reduced FDI.
- UK-EU trade agreement negotiations and CTR coordination (issue linkage), will become difficult post-Brexit. Trade deal uncertainty may decline foreign investor confidence for UK investment, dampening FDI.
The Zodrow Mieszkowski-Wilson (ZMW) Model
The negative economic impact of decreased UK FDI can be analysed through an adaptation of the ZMW model.
Figure 2 illustrates the UK and EU marginal product of capital (MPC) curves, demonstrating how UK-EU capital allocation alters with MPC. The left Y-axis represents UK MPC, the right Y-axis represents EU MPC, the X-axis represents UK and EU capital allocation.
Figure 2
The UK and EU Capital Allocation
(Adapted from Keen and Konrad, 2012:15)
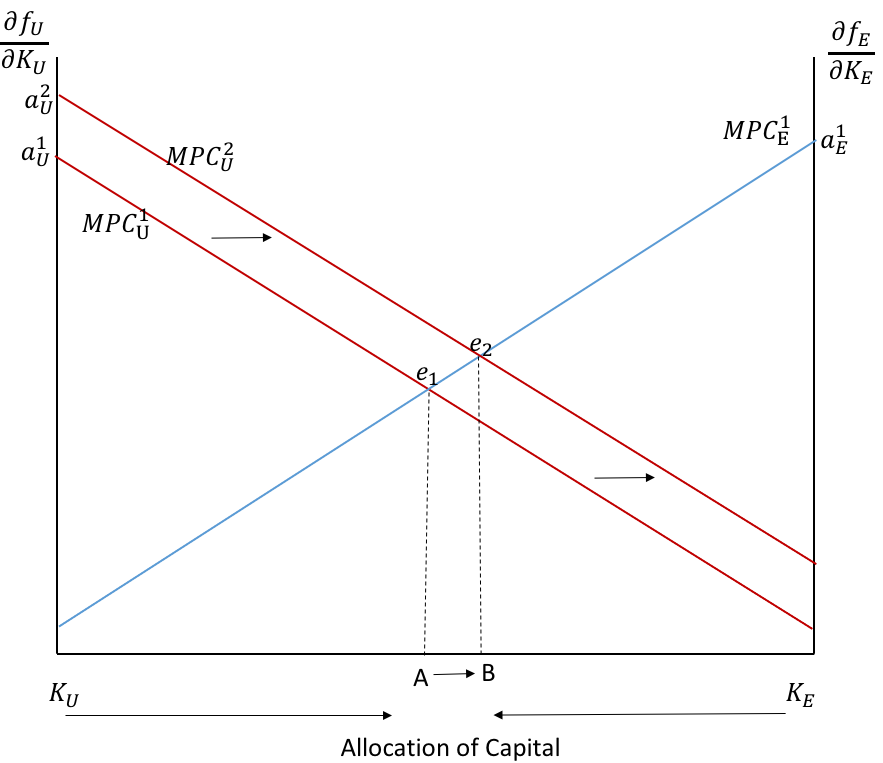
MPCU1 illustrates the UK MPC curve, whilst MPCE1 illustrates the EU’s MPC curve. MPCU1 and MPCE1 intersect at the capital market equilibrium, e1. Here, each country is satisfied with the capital allocation for the given MPCs, therefore neither wishes to deviate.
These curves demonstrate that, assuming ceteris paribus, decreased UK CTRs increases UK FDI/capital: EU capital flows to the UK. Whereas decreased EU CTRs decreases UK FDI/capital: UK capital flows to the EU.
Reduction of FDI into the UK and International Tax Competition Initiation
The loss of access to the single market, increasing UK export costs to the EU, reduces the UK’s MPC. MPCU1 shifts left to MPCU2 in Figure 2. The equilibrium shifts to e2: FDI attractiveness into the UK decreases, yet FDI attractiveness into the EU increases. UK capital thus decreases, whilst EU capital increases, as capital flows from the UK to EU, moving from point A to B in Figure 2. Reduced UK capital decreases UK tax revenues, creating an inefficient public spending level – citizen welfare thus decreases (Hillman, 2009). Triangle ‘X’ (F2) illustrates deadweight welfare loss produced.
To increase FDI attractiveness, the UK government are expected to reduce CTRs. Decreased UK CTR reduces post-taxation business profits, stimulating increased FDI attractiveness, thus increasing UK capital. In 2017, Phillip Hammond announced government plans to reduce CTRs in 2020 to 17%, suggesting government believe Brexit will harm UK FDI attractiveness (Parliament. House of Commons, 2017). The UK can adopt attractive CTR reductions as will not be constrained by EU state aid control post-Brexit.
The impact of reduced UK CTRs can be analysed through UK and EU best response functions, BU1tE and BE1(tU) respectively, which show the optimal UK CTR for a given EU CTR.
Figure 3
The UK and EU Best Response CTRs
(Adapted from Keen and Konrad, 2013:272)
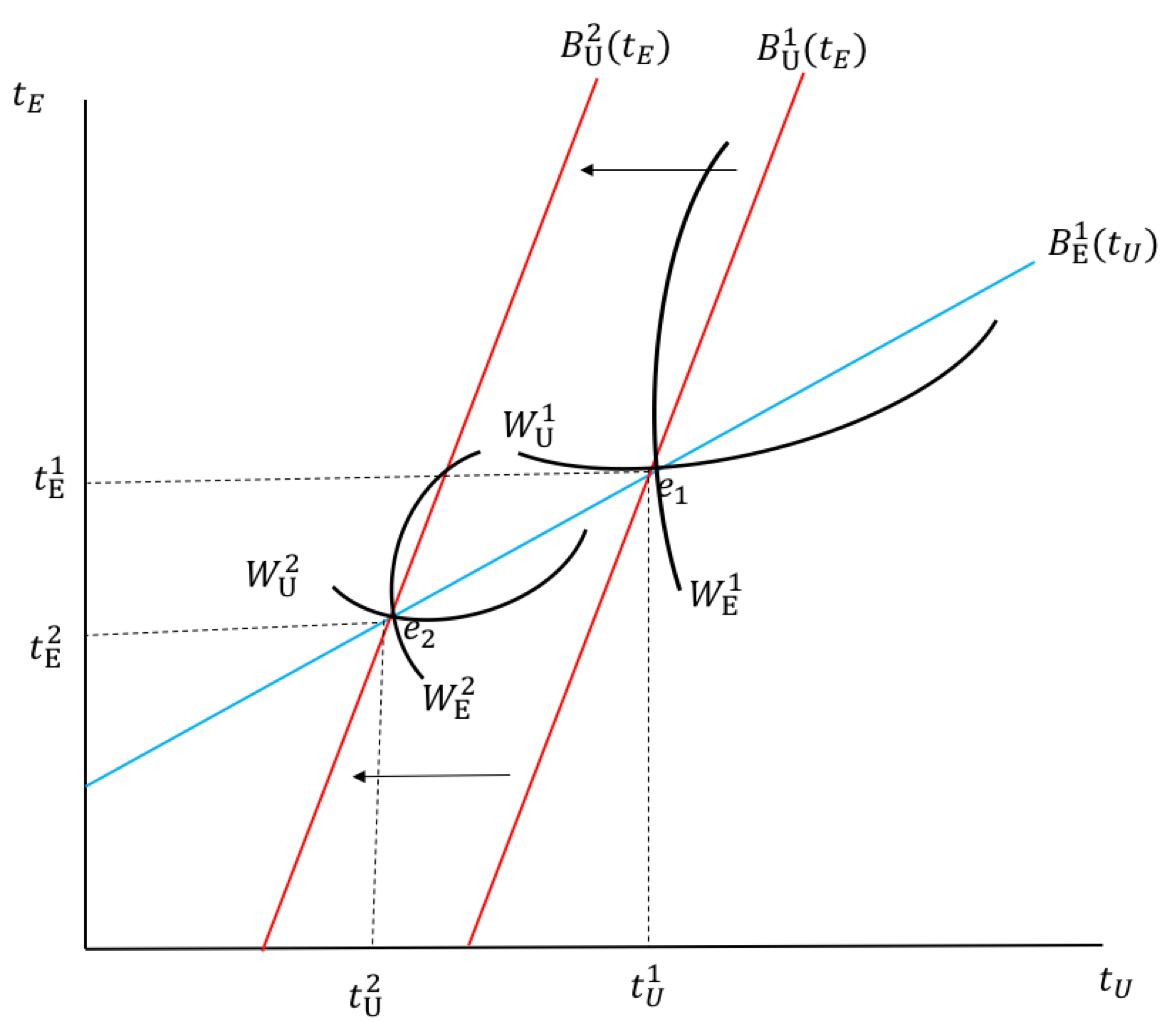
The upward sloping BRF curves highlight UK and EU CTRs are strategic complements; if UK CTRs decrease, EU CTRs decrease (Zodrow, 2003). WU1 and WE1 represent the UK and EU iso-welfare curves, illustrating the combinations of UK and EU CTRs that produce the same welfare level (Keen and Konrad, 2013).
The intersection of BU1tE and BE1(tU) and their respective iso-welfare curves at e1 is the pre-Brexit Nash equilibrium (NE) – demonstrating the welfare maximising CTR for each country given the CTR of the other, hence neither country wishes to deviate from e1 (Keen and Konrad, 2012).
To reduce UK CTRs, the UK’s BRF curve shifts left to BU2tE in Figure 3. The equilibrium shifts to e2, and optimal UK CTRs decline to tU2. As UK and EU CTRs are strategic complements, decreased UK CTRs ignites ITC and hence the EU also decreases their CTR to tE2. Consequently, new iso-welfare curves (WU2 and WE2) intersect BU2tE and BE1tU and at e2.
As WU2 and WE2 are closer to the origin, UK and EU welfare at e2 is reduced compared to e1, as decreased CTR reduces tax receipts, leading to suboptimal levels of public spending and citizen welfare – the implications of ITC initiation (Mitu, 2009).
Implications of Potential Reduced UK CTRs
To increase tax receipts, the UK government may introduce a preferential tax regime, implementing lower CTRs for multinational companies, attracting FDI, whilst higher CTRs for immobile domestic small and medium enterprises (SMEs), who face difficulty evading tax or relocating (Mitu, 2009). Yet, this regime may negatively impact regions more than others, including the heavily SME dominated South-West.
The effectiveness of decreasing CTRs to increase FDI attractiveness may differ by sector; decreased CTRs attracts service sector FDI more than, for example, manufacturing. Yet this will not significantly impact the effectiveness of decreased UK CTRs, as the service sector contributes towards approximately 79% of UK Gross Domestic Product (Parliament. House of Commons, 2018).
Additionally, Freedman argues the proposed UK CTR reduction has already sparked ITC following Trump’s announcement of USA CTR reductions; this may potentially intensify the anticipated UK-EU ITC.
An Alternative View: Brexit Positively Impacts the UK
There exists the alternative opinion that Brexit may benefit the UK. The removal of EU directives and tax incentive restrictions may turn the UK into a ‘tax haven’, increasing FDI attractiveness.
This increases the UK’s MPC, shifting their MPC curve right to MPCU2 in Figure 4 below. The equilibrium consequently shifts to e2, and capital allocation shifts from point A to B: capital in the UK (FDI) increases, whilst capital in the EU decreases.
Figure 4
The UK and EU Capital Allocation
(Adapted from Keen and Konrad, 2012:15)

In response to increased UK FDI attractiveness, the government may increase CTRs, increasing tax revenues without substantially deterring FDI. BU1(tE) hence shifts right to BU2tE, illustrated in Figure 5.
Figure 5
The UK and EU Best Response Corporate Tax Rates
(Adapted from Keen and Konrad, 2013:272)
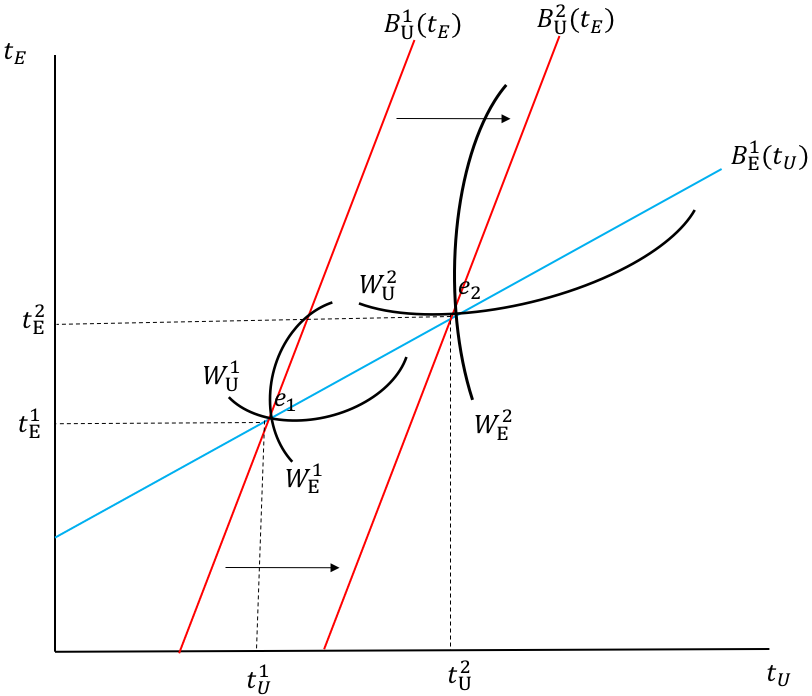
The equilibrium shifts to e2, UK CTRs increase to tU2, increasing EU CTRs to tE2; ITC is not triggered. New iso-welfare curves, WU2 and WE2, intersect the BRF curves at e2. WU2 and WE2 are further from the origin: increased CTRs boost tax revenues and government spending, raising UK and EU welfare (Zodrow, 2003).
However, given previous analysis and the EU single market benefits, if the post-Brexit trade deal between the UK and EU fails to replicate current free trade agreements, economic theory suggests Brexit will more likely harm the UK, through triggering ITC, than be beneficial.
Potential Impact of Brexit on the Remaining EU
Figure 2 analysis demonstrated decreased UK FDI attractiveness post-Brexit decreases UK FDI/capital, whilst increasing EU FDI/capital. Increased EU capital and FDI promotes short-run and long-run economic growth, as increased investment raises aggregate demand, and increased EU capital expands the economy’s productive potential: the EU hence benefits.
However, without a post-Brexit free trade deal, EU businesses will lose free UK-exporting rights, decreasing EU FDI attractiveness. Similar to UK analysis, this may trigger an outflow of EU capital. The EU may also respond by decreasing CTRs to attract FDI, further triggering UK and EU ITC. Yet, as previous analysis suggests Brexit is more likely to ignite ITC, F2 analysis demonstrates that regardless of Brexit’s impact on the EU, strategic complementation means decreased UK CTRs, igniting ITC, decreasing EU CTRs and welfare.
Arguably, Brexit will harm the UK more than the EU, as 14% of UK GDP originates from exporting to the EU, whereas EU exporting to the UK accounts for just 3.5% of EU GDP (Haupt, 2017).
Post-Brexit Recommendations
Assuming Brexit potentially harms UK FDI, sparking ITC, analysis of ITC limiting solutions is appropriate.
The resulting non-cooperative post-Brexit NE, e2, in Figure 3 is not Pareto efficient. A Prisoners Dilemma exists as a Pareto improvement is attainable with cooperative tax coordination, moving to either CTR tU1 and tE1, or to a rate within the lens created by WU1 and WE1 (Figure 3). Cooperation increases CTRs, tax revenues, and welfare, assuming governments want to maximise citizen welfare, as the iso-welfare curves are further from the origin (Zodrow, 2003). Consequently, economic integration (trade agreements and CTR coordination) should remain at their current level post-Brexit, preventing ITC initiation, safeguarding UK-EU competitiveness and citizen welfare.
Conclusion
The impact of Brexit on ITC depends on post-Brexit UK-EU trade agreements, and how this shapes UK and EU FDI attractiveness. This article analysis reveals that given the removal of current free-trade agreements, Brexit is more likely to harm attractiveness of FDI into the UK, triggering ITC. Owing to the resulting UK-EU tax receipt and overall welfare reduction, prevention of stimulating an ITC race to the bottom is socially optimal, and hence a suitable recommendation is to implement the same UK-EU level of economic integration post-Brexit.