


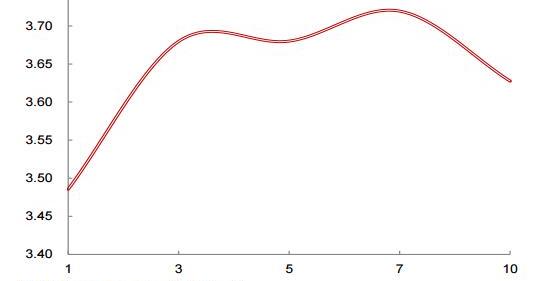
Since April, under the impact of strong supervision and financial shrinking, the Chinese bond market experienced a rapid decline again. The recent yield curve appeared in a series of abnormal spreads phenomenon. On May 17th, the 3Y and 7Y Treasury Bond rate are significantly higher than the 5Y and 10Y Treasury Bonds interest rates, leading to a “M” shaped yield curve.
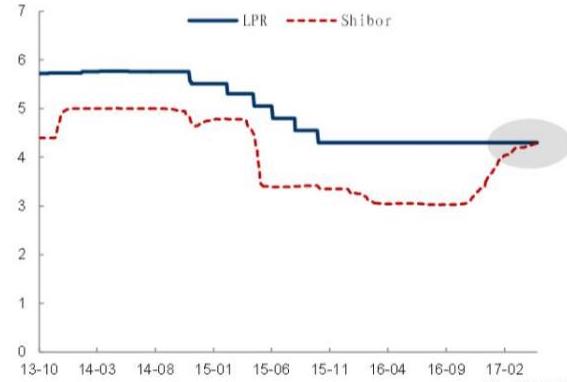
On May 22th, the one-year Shanghai interbank interest rate (Shibor) was 4.3024%, reaching its highest in more than two years. For the first time it was even higher than the Shanghai interbank market one-year loan base rate (LPR), just one step away from the one-year central bank loan interest rate 4.35%. This also means that the cost of interbank financing is more than the real economy loan interest rate.
The prediction effect of yield curve
What is the relation between yield curve and recession?
For a long time, economists and policymakers have been looking for leading indicators that can accurately predict the economic cycle, it turns out that the yield curve is one of the most effective indicators. A large number of literatures show that the form of the yield curve is an effective indicator of the prediction of recession, especially in Europe and North America. For instance, the yield curve (10-year Treasury bonds and 3-month national debt spreads) can forecast two to six quarters ahead of the recession. If the yield curve appeared upside down, there would be a recession within five quarters.
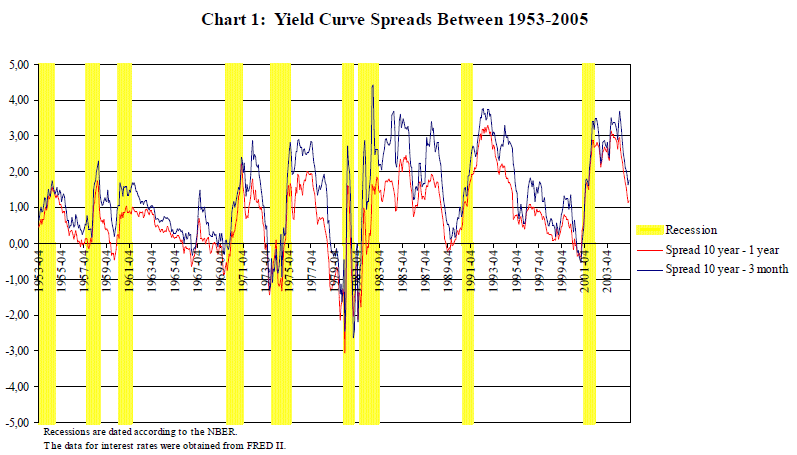
Ironically, the US yield curve in early 2006 appeared “upside down” shape, where 1-year and 5-year bond yields appeared to have slightly “upside down”. The Fed has published two papers to study the relationship between yield curve and recession and the results showed that the shape of the curve has a good predictive effect on the recession. On 2006, the Federal Reserve’s study demonstrated a significant negative correlation between spreads of the 10-year Treasury Bonds and 3-month Treasury Bonds and real GDP in the next few quarters, and a significant positive correlation with the recession. The pattern of yield curves is upside down in six recessions before 2006. If we count the 2008 subprime mortgage crisis, the past seven recession in United States related a “smooth” and “upside down” yield curve.
Why does the yield curve have a predict effect?
In general, the yield curve has three forms: “normal”, “smooth” and “upside down”. “Normal” form suggests that the economy is in a relatively healthy state, and “smooth” or “upside down ” form show that the economy may be problematic, suggesting that a potential recession or even crisis may occur. For instance, in 2006, shortly after the US Treasury yield curve showed a “smooth” pattern, there comes an outbreak of the subprime crisis.
There are two factors which affect the shape of yield curve, which are monetary policy and investor’s expectations. Since the monetary policy have crucial impact on short-term interest rates, it is likely to affect the yield curve form as well. Meanwhile, the central bank can also influence long-term interest rates through distortions or other structured monetary policy instruments. Also, investors’ expectations of future inflation and short-term interest rates can also affect the yield curve.
Under the expected hypothesis, the term spreads measure the difference between the current short-term interest rate and the average expected short-term interest rates. As a result, the term spread has also become a measure of monetary policy trends. The greater the spread, the tightening the monetary policy, and the greater possibility of the recession in next quarters. In addition, the yield curve also reflects the investor’s expectations. If the yield curve demonstrated a “smooth” or “inverted” form, the investors would expect a future inflation and decrease in interest rates, and therefore will reduce consumption and investment, leading to an economic recession.
What’s behind the M-shaped yield curve of Chinese bond market?
Possible reasons explaining the M-shaped yield curve
On the one hand, the current regulators are still pursuing a multi-objective goal in the process of macro-control; On the other hand, the central bank frequently use the temporary monetary policy tools like OMO and MLF, which further enhance the market’s expected differences. As for the quantitative tools, since the central bank reduced the reserve ratio for the last time on March 2016, they suspend the use of reduction tools for 14 consecutive months. The huge liquidity gap caused by capital outflows is mainly supplemented by the above-mentioned temporary tools. From the aspect of pricing tools, in order to achieve the purpose of deleveraging, the central bank is also take tightening of liquidity temporary measures to raise the level of market interest rates.
It should be noted that there is still essential difference between the above temporary tools and the reduction of interest rate. One of the most distinctive differences is that the above tools have a strong reversibility. In other words, the central bank can adjust the monetary policy according to the latest changes in domestic and foreign markets at any time. The use of temporary tools, while increasing the central bank’s monetary policy flexibility, also disrupted the market expectations. One of the direct expressions of the expected disorder is the emergence of the M-type yield curve. The uncertainty of expectations, making seemingly risk-free arbitrage opportunities be in a certain risk. The disappear of arbitrage opportunities makes the yield curve towards a M-shape without being corrected.
Future bond market forecasts
The expected disruption will bring many adverse effects to the market and even interfere with economic activity. Historical experience shows that the unconventional shape of rate of return indicating that the economy may be in an unfavorable situation.
Because of the structural mismatch of underlying assets and source of funds, moderate deleveraging measures will elongate the time phrase of deleveraging; However, if the central bank increases the intensity of deleveraging measures, the instability of financial markets may increase. Along with exchange rate environment, the current central bank’s monetary policy has been caught in the dilemma. If there is no impact of the external financial environment, domestic financial risk would be possibly able to gradually die away through the policy fine-tuning. However, taking into account the US economic recovery and the limited effect of Europe’s loose monetary policy, there may not be enough time to eliminate the internal financial risks.
In the short term, the long-term yield would rise again, which correct the current the yield curve. As for the short side of the yield curve, from the central bank’s recent aspect, the market’s liquidity situation is expected to stabilize. In the longer term, if the economy experience a slowdown in the next half year, which resulting in monetary policy adjustments, then the possibility of decrease in short-term rate of return will be greater.