


Although increasingly being adopted globally as a trade funding solution, the usage and provision of receivables finance is still principally focused in Europe, where last year over 60% of the global volume of client turnover was based. So clearly, at least for now, it’s the most important regional market by size. But what else can the numbers tell us?
Back in the early 2000s when my then corporate role was strategy-based and I was comparing potential markets for entry, I introduced the straightforward idea of comparing country attractiveness and opportunity by looking at the GDP penetration, that is the proportion of the country GDP that its RF business represented as a percentage.

Since I introduced it to IFG in 2009, this simple measure has come widely to be used as a comparator by people in the world Industry; the global average is now around 4%, for the EU 28 it’s 11% whilst the most penetrated or established markets peak around 15%.
By the way, this also gives a very clear flavour for the potential scale of the global market; if 4% penetration is around €2.7 Trillion – the total client turnover figure for 2018 – then 15% would be around €10 Trillion.
So it was 11% penetration last year in Europe; what will it be by the end of 2019? Last year the client turnover volume in the European market grew overall by nearly 8%? What will it do in 2019?
To try to answer this question, within my consultancy business Roundwindow I look at the relationship between GDP growth and RF growth. And it turns out that since 2006, there is a statistically significant positive relationship between the two variables; a relationship which appears to hold true at country, regional and global levels.
If we take the annual rates of growth reported for the Industry in Europe (as collated by the EUF) and for GDP (by the EU statistics body, Eurostat) and plot them together over time, we see the following picture:
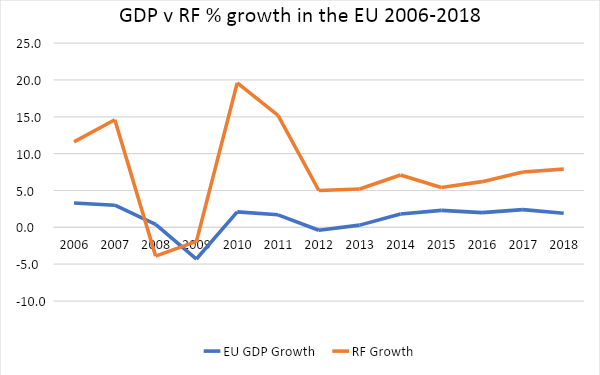
You can see there is clearly some sort of tracking relationship, although its equally obvious it’s not a simple one; and the volatility in the RF growth/ reduction is very high compared to that of the GDP.
We can look at this more closely; if we make a graph of each pair of data points for every year, we can use statistical analysis to give us some useful feedback on the relationship.
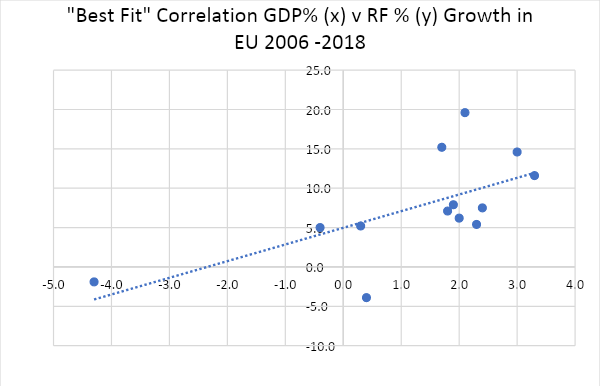
The dotted line shows the overall best fit relationship between these data points and the correlation coefficient – which shows how closely the two data sets are related – works out at 0.64, a figure which statisticians will tell you means there is a significant relationship between the two variables. It’s not saying that one causes the other, but that they are meaningfully linked. (If the two were completely correlated with a coefficient of 1, all the dots would be on the line, like birds on a wire; if there was no relationship, coefficient 0, they would be completely randomly scattered across all four quarters of the graph.)
And this line of best fit shows us that for every 1% of Global GDP growth, we can expect around 2% of RF Industry growth, with a baseline around 5%. Which of course is great news when the European economy is growing; but it won’t be such good news if we face a recession, where the growth of RF will correspondingly fall.
The latest EU economic forecasts in July indicate that there will be average weighted growth of 1.4% of EU GDP in 2019 (although this figure presupposes a “deal-driven” Brexit).
Let’s assume that the good people at Eurostat have got their numbers right; then using our line of best fit, this would suggest expected growth in the European Receivables Finance Industry for 2019 will be approaching 8%.
However, this said, two of the largest economies and biggest users of receivables finance (Italy and Germany) are now expected to show marginal GDP growth for the whole year, so they may have a disproportionately negative effect on the overall picture.
And so before you rush off to your bookmakers to place bets on this outcome, recognise that the relationship is a correlation, not a simple cause and effect – of course, influences other than GDP will affect industry performance. But if you would like to offer me some odds, then I’m listening!
I believe in-depth analysis of the data we see in Receivables Finance is important for the Industry in developing its worldwide advocacy role; accordingly, I am pleased to note that I will be working with WOA, where we will continue to ensure that global analysis looks beyond headline volumes.