


“Exporters may have to adapt to slower gains in commodity revenues with economic diversification, while importers could take advantage of lower commodity prices for increased investment.” – Ceyla Pazarbasioglu, World Bank Equitable Growth, Finance & Institutions Vice President.
TFG took a deep dive into the world of commodity markets and oil prices in 2019. What’s been driving prices, and what is the impact of geopolitics on major commodity markets? TFG’s Ross McKenzie investigates.
TFG Exclusive Video: Commodity Finance in 2019
The term ‘commodity’ is a broad one, covering physical assets such as oil, wheat, gold and countless others. Commodity markets have proved fruitful in the past, with commodities such as oil being used to fuel much of the world’s economic improvement of the past 50 years.
2018 saw global commodity markets fluctuate greatly. Gold had a relatively turbulent start to the year until April when it hit 1353.8, and began its 4 month downward spiral to 1181.2 (-12.75%) in August. It did however recover back to 1275.1 by the closing week of December ’18.
Then there were trade wars, resulting in tariffs and sanctions on certain imports. This greatly affected global markets, specifically the Oil market. For example, sanctions such as the US oil sanction against Iran caused a sell-off and low confidence around oil. In December of 2018 – a month after the sanctions were raised – US Crude fell to its lowest value in well over a year. On top of this, Crude oil benchmarks were reported to have lost at least a third of their value.
Sanctions raised against Iran by President Trump resulted in the Organisation of the Petroleum Exporting Countries’ (OPEC) third largest producer slip into a deep slump with the IMF reporting possible inflation levels of around 40%. Prior to this slump, Iran was producing 2.5 million barrels per day for the global economy, which equated to around 2.5% of global supply.
Political developments outside of the US also contributed toward an uncertain 2018, with Brexit causing a significant amount of uncertainty and rising global trade tensions. In October of 2018, the IMF published their World Economic Outlook (WEO) in which they revised their April global growth prospects by -0.2%.
The commodity markets are therefore invaluable to the development of global economic progress, but how exactly are they believed to perform in 2019 after such an unstable 2018?
Oil 2019 Performance/ Trends
Taking politics out of the question, there is also the societal view toward environmental policies that are solidifying all around the world. With a heavier focus on renewable energy, oil and gas companies are likely to financially suffer in the future unless their portfolio’s become more diverse.
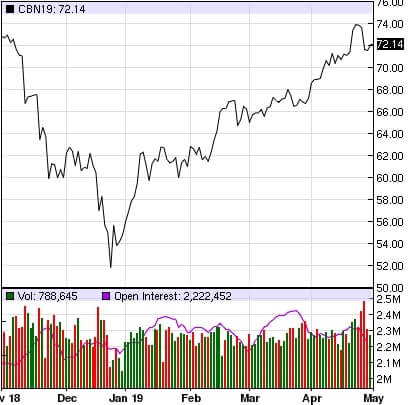
In line with the law of supply and demand, OPEC’s restrictive production cuts have resulted in a sturdy increase since the lows of December 2018. Brent Crude was at a low of $52/bbl, but has since risen to $74/bbl toward the end of April. Brent has entered May at $72/bbl, which is still a 38% increase on December’s price.
Crude Oil Brent Price
- Nasdaq
With US production growing at a global record-rate, demand is believed to be stimulated in 2019, which should level Brent out fairly mid-way between the December low (brought on by sanctions) of $52bbl and the April high of 72 (brought on by a growth in non-OPEC production).
The performance of oil in 2019 is largely dependent on governmental and organisational policy implications. For example, if OPEC decide to remove or significantly reduce their restrictive measures, but US production continues to grow as expected the market could run away with itself, with an excess supply and price plummet.
Base & Precious Metals 2019 Outlook
After suffering a weighty drop in the last quarter of 2018, the World Banks’ Metals and Mihttps://www.tradefinanceglobal.com/finance-products/ores-and-minerals/nerals Price Index has increased 1.7% in the first quarter of 2019.
Metals had a reasonable steady start to 2018, until they were met by US-Chinese trade tariffs. Because of the current universal uncertainty in global trade, and thus the world, economy the price of metals suffered a substantial hit.
However, the majority of metal commodity prices rebounded in the first quarter of 2019, with US-Chinese trade negotiations picking up and an overall economic improvement in the Chinese market resulting in a stronger price for most metals.
Price of Gold 2016-2019
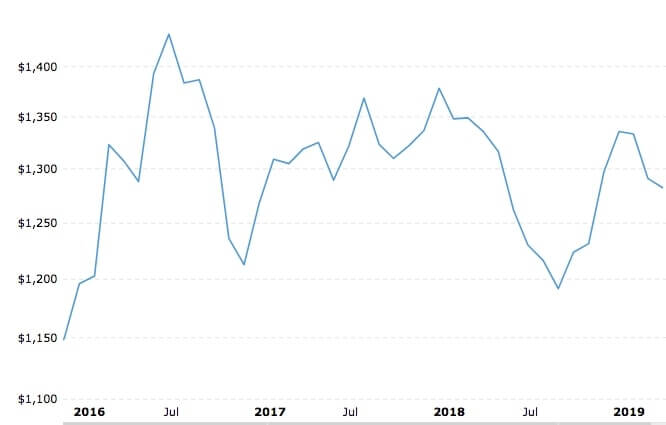
Gold had improved by 2.9% until its peak of $1,333.40 in February, where it has been falling ever since and at the time of writing is valued at $1,282.15. This downward trend is likely to be explained by a well-covered lack of faith from ECB policymakers surrounding projections.
Gold ultimately recovered well in the last month of 2018, coinciding directly with the Dollar’s indecisive decline. What’s more, is that as the dollar then grew by 2.9% from 9th January to 1st May, Gold has since dropped 4.034% from $1,335.73 to $1,281.80
USD Value December 2018 – May 2019
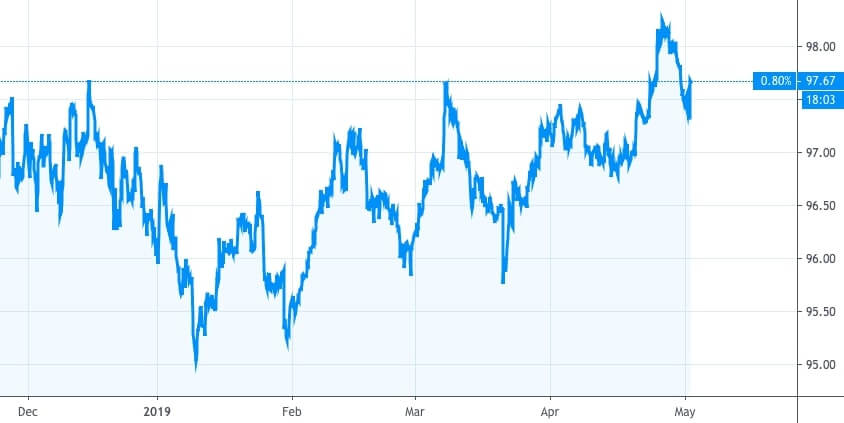
This drive in the Dollar is largely attributed toward the performance of the US economy as of late. According to the Bureau of Labor Statistics approximately 196,000 jobs were created in March, 2019 alone and the national unemployment rate stayed constant at 3.8%.
Inflation has increased slightly in March, moving from 1.52% to 1.85%. Such low inflation paired with a relatively minor unemployment rate exhibit a strong economy, which the dollar has benefited from alongside an end to the Fed’s monetary expansion policy and a lowering of the Euro.
This being said, in the long run low inflation and low unemployment are not realistic. In the short run as inflation begins to rise there may be an increase in wages which would attract more of the labour force. However, as inflation pulls away it inevitably worsens the economy.
Other metals that performed well and contributed to the commodity market’s impressive Q1 include Copper, which was up 5.9%; nickel gained 4.6% and zinc gained double figures with just under 19% for YTD.
Of course, there are numerous supply side concerns that are playing their part in the price of metals. Concerns around disruptions in iron ore production due to the Brazilian Dam disaster along with Chinese fiscal measures are expected to largely drive the metal’s value the further into 2019 we go.

TFG recently partnered with Knect365 as media partners of ‘Structured Commodity Finance’ in London last month. Find out more here.
Agriculture’s 2019 trends
Wheat:
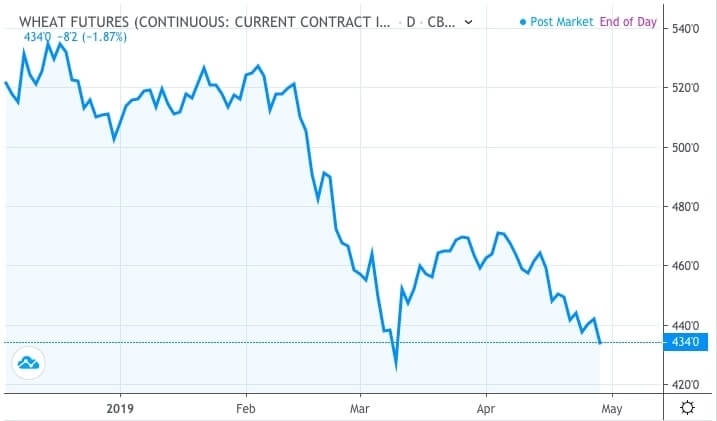
The price of wheat had a rough start to 2019, starting at 504, it is now worth 433 – a -14.1% drop in value. This is due to a productive crop yield worldwide as of late. With good weather and good harvest, unfortunately comes excess supply which drags the price of wheat.
The United States Department of Agriculture said in a report that out of the total winter wheat crop, 64% is in good-to excellent condition, which has driven fears of a supply flood leading to hesitation in the market. This hesitation paired with US tariff’s has resulted in a drop in demand for the crop.
Wheat Futures 2019
Corn:
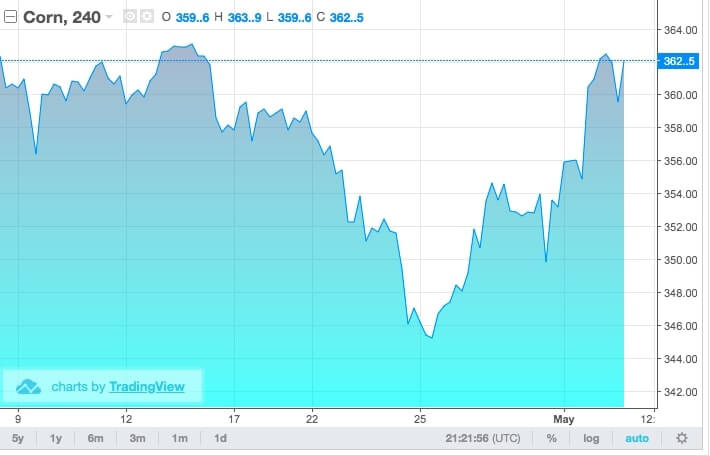
Corn entered into 2019 with a value of 376.1, and had an equally bleak first quarter ending -6.3% down at 352.4. However, going into April Corn has started a significant recovery, as it now stands (at the time of writing) at 362.5 – a 2.86% increase over a month. This is a promising trend for Corn in Q2.
The recovery in value can be accredited to concerns over American planting delays. Because of this, Corn exports in the US amounted to 31.3 million bushels of Corn last week alone – a moderate gain on last week’s 30.7 million.
Corn 240 price 2019
Soybean:
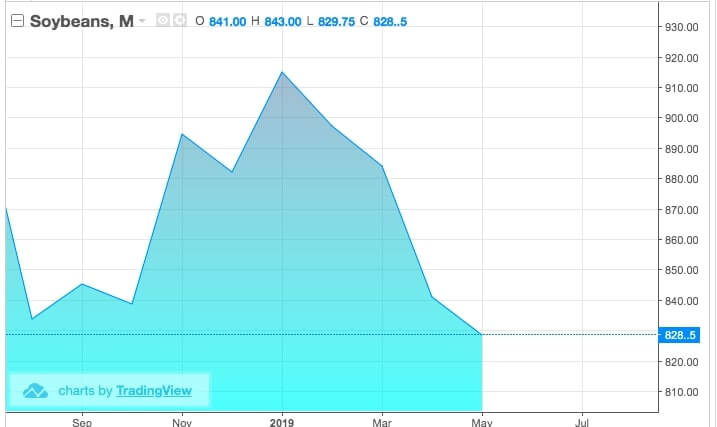
Last and unfortunately least, Soybeans has had the worst 2019 of all agriculture crops; Much like with both wheat and corn, the first quarter was rather harsh of Soybean prices and it is yet to recover.
Just as wheat’s production initially suffered from largely positive weather conditions, Soybeans has alas, not come out the other end with regard to supply.
The USDA reported in their March review that their total for the year was up 3.9%, and at this point the price and performance of Soybeans is somewhat dependent on the possibility of a US – Chinese trade deal to clear some of the stock.
The Chinese impact on the soybean market is perfectly illustrated below. If we look back to December, Presidents Trump and Xi Jinping reached a temporary truce of 90 days to allow for negotiation talks.
If we then look to December 2018 on the graph below, we can see a sharp increase in the price of soybeans due to increased demand that was largely driven by a – albeit limited – growth in the confidence brought about by the truce.
Soybeans 2019 Performance
The US – Chinese Trade war’s implications
The above price reactions are an grand example of just how much weight a good trading relationship between the world’s top two economies truly carries in the global markets. For commodity farmers in the United states, they are caught between two colossal opponents – for example, the above agriculture charts depicts a lowering of wages for farmers.
If you pair lower wages, with more expensive metals, oils and machinery then it is near impossible for workers to be made and machines maintained. This is not good for US farmers. In 2018, US agriculture exported $83bn to Canada, Mexico, EU, Japan, S. Korea and China alone.
Commodity round up – a common theme
The above effect is unfortunately seen in many other industries, and although some have benefited from fluctuating prices, there have irrefutably been those that have substantially lost.
For the metals commodity markets, the costs involved and uncertainty surrounding trade wars is simply too much. If a trade deal is reached, then metals will do well as we saw with the aforementioned base metals reaction to promising trade talks.
However, if there is no trade agreement reached and tariffs remain as they are, or (as they are more likely to do) increase further still then the metal commodity market will not benefit.
When it comes to oil, one must account for governmental implications such as sanctions mentioned previously, but also organisational ones such as OPEC’s decisions. Remember the OPEC consists of:
- Algeria
- Angola
- Ecuador
- Equatorial Guinea
- Gabon
- Iran
- Iraq
- Kuwait
- Libya
- Nigeria
- Qatar
- Republic of the Congo
- Saudi Arabia
- United Arab Emirates
- Venezuela

Because of this, OPEC have not been willing to cut production past a certain point as it does not want to give up market share as US shale production increases. Because of this, there is limited room for price control.
Overall, global political and trade tensions carry a significant weight in the determination of commodity markets. Therefore, the developments – or lack thereof – of these political tensions play a major role in the performance of commodity markets such as metals, agriculture and oils.