


In modern days, real estate is becoming more and more a part of an investor’s portfolio. Ibbotson and Siegel (1983) estimated that more than half of global wealth is in real estate.
The 2006 Luxembourg Wealth Study found that the share of real estate in household portfolios across various countries ranged from 25 to 65 percent (net of debt), while the share of real estate investments ranged from 9 to 23 percent. Furthermore, the investment proportion allocated to real estate has been increasing gradually for the last five years in the UK. In the following project, we will discuss the impact of adding real estate in a mixed asset portfolio of UK assets and the issues that appear from its analysis.
Real Estate in a Portfolio
The basic principle for risk reduction of an investment is to constant a well-diversified portfolio. Diversification strives to smooth out unsystematic risk events in a portfolio, so the positive performance of some investments neutralizes the negative performance of others.
Therefore, the benefits of diversification hold only if the securities in the portfolio are not perfectly correlated. In that manner, academic research suggests that real estate has little to no correlation with the other assets in a mixed asset port, so that makes it a diversification tool for the manager.
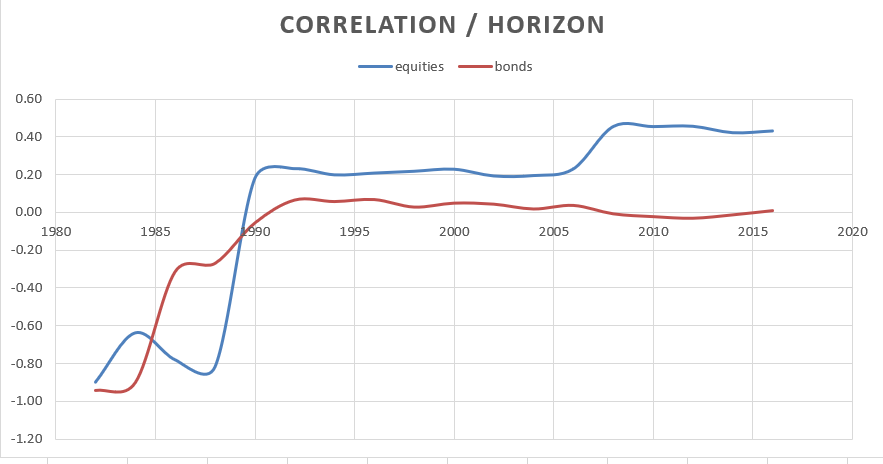
The graph below shows that the correlation of RE with the other asset classes decreases with the increase of the investment horizon. It’s therefore ideal to include RE in a MAP (Mixed Asset Portfolio) as a long-term investment. The findings suggest that the correlation increased in the period of the economic crisis of 2008, showing that correlations might increase during extreme market movements but not enough to wipe out the diversification benefits, as it remains in low levels. It’s also visible that correlation with bonds is almost zero in the long run.
Most academic studies come to the conclusion that adding real estate does improve the risk-return profile of a mixed-asset portfolio and provides both return enhancement and risk reduction benefits, as it can reduce volatility of the portfolio by approximately 15%. It’s worth noting that the gain in return from adding real estate to the mixed-asset portfolio is typically less compared with the reduction in portfolio risk.
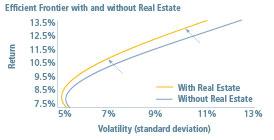
Moreover, the inclusion of direct real estate ownership into a diversified portfolio of investment assets has the further benefit of reducing a portfolio’s vulnerability to the effects of inflation. In contrast, the performance of publicly traded real estate instruments is closely correlated to equities and thus does not improve the risk adjusted return of an otherwise equity focused portfolio. The importance of including real estate in the port can be shown through the efficient frontier. In the following graph it is visible that the efficient frontier expands upwards opening greater range of risk-return possibilities to investments managers.
Desmoothing
One major issue when adding real estate to a MAP is the valuation process of real estate, which mostly relies on backward-looking comparisons and therefore result in individual property valuations which vary less than market prices. Researchers claim that the valuation methods used understate the true risk of property investment and so the returns fall to what is called ‘smoothing bias’. Therefore, de-smoothing is needed to account for the issue. The following formula estimates the de-smoothed returns.
True Returnt = (Valuation Returnt – k x Valuation Returnt-1) (1 – k) Where k is a desmoothing coefficient taking a value between 0 and 1, which represents the weighting in current valuations of new market evidence. (Index Smoothing and the Volatility of UK Commercial Property. (2007))
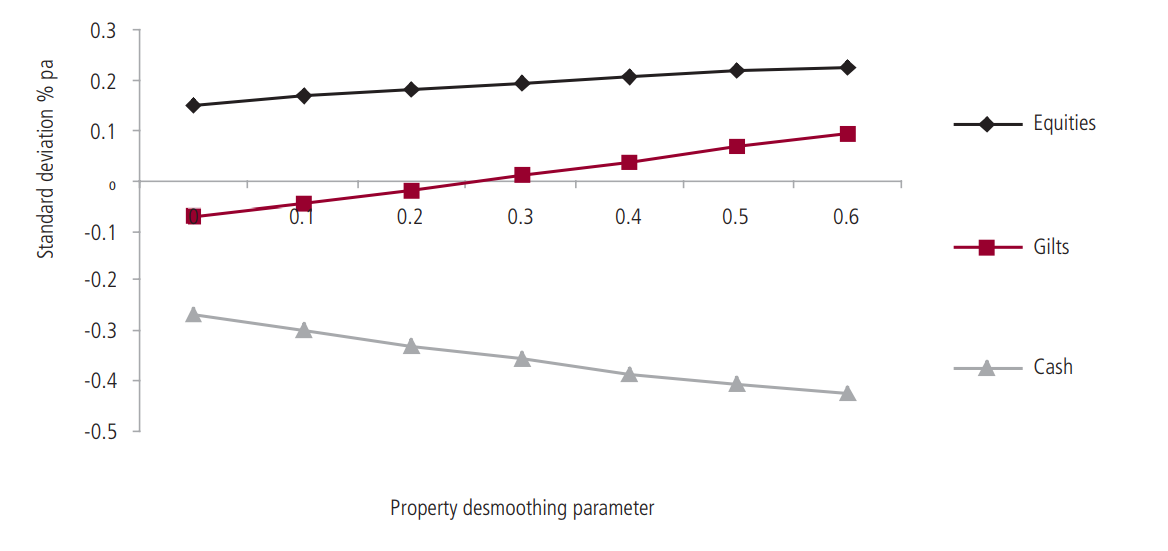
A primary purpose of de-smoothing returns is to place property risk in a relationship with other assets. The aftermath of increasing property volatility is that the correlation with the other asset classes increases. As the property de-smoothing parameter increases, so does its standard deviation.
Index Smoothing and the Volatility of UK Commercial Property. (2007). .
De-smoothing which raises property standard deviation to 13% to 15%, or by a factor of 1.3 to 1.5 over Index standard deviation, is enough to lift property into its expected position between equities and bonds.
The second reason to apply de-smoothing methods is to come up with weights for property in optimised portfolios which are a better fit with financial theory and investor behaviour. In the academic literature many studies based on data for the UK suggest that de-smoothing does produce a reduction in property weights in the optimal portfolio.
Index Smoothing and the Volatility of UK Commercial Property. (2007). .
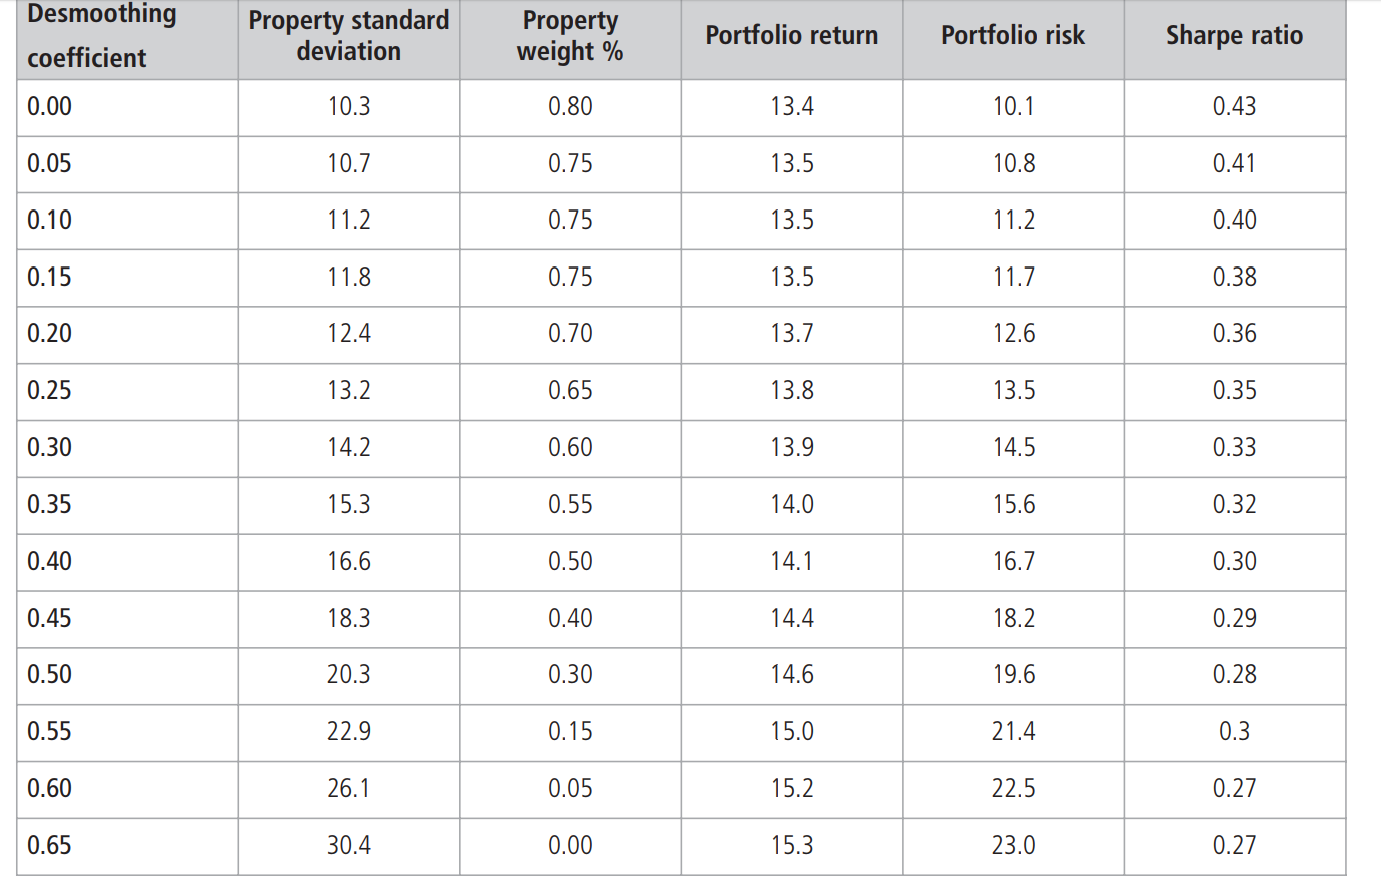
The increase in the de-smoothing coefficient decreases the weight of property, along with its Sharpe ratio. The continuously decreasing Sharpe ratio indicates that the efficient frontier of our port tends to move to the right, increasing the risk for our given return.
Neutral de-smoothing assumptions: At low levels of de-smoothing, increasing the property standard deviation cuts the property weight and shifts the allocation primarily into increased holdings of cash.
Extreme de-smoothing assumptions: The weights fall below 15% which pushes property standard deviation close to equities and induces substantial negative serial correlation in the de-smoothed results. As the de-smoothed volatility approaches that of equities, equities increasingly act as the substitute for the falling property weight.
Standard Deviation or Cross Correlation Effect?
Decreases in property weighting induced by de-smoothing are the joint product of the increase in standard deviation and changes in cross-correlations with other assets. De-smoothing increases property correlations with equities and bonds but decreases the already low or negative correlation with cash. Note that in cash-heavy portfolios at the low risk end of the spectrum, the correlation impacts of de-smoothing may be positive on the property weight, due to the reduced correlation with cash. Generally, however, de-smoothing induces falls in the property weighting predominantly through the increase in standard deviation, and relatively little through changes in correlations with other assets.
On the neutral de-smoothing cases, changes in correlations induced by de-smoothing never account for more than four percentage points of the total reduction in property weights. In high risk portfolios the Correlation Effect accounts more than one-fifth of the total de-smoothing impact. More aggressive de-smoothing assumptions increase the absolute change in portfolio weights attributable to correlation effects, and slightly increases the share of total changes accounted for by correlation effects rather than volatility effects.
De-smoothing increases property risk and reduces diversification benefits against gilts and equities, thereby reducing the weighting to property indicated by Mean Variance Portfolio optimisations but even at extreme levels of de-smoothing, property’s correlations with gilts and equities tend toward an upper limit, so substantial diversification benefits are retained.
In summary, valuation smoothing may in part be taken as a product of the valuation of individual properties. Following that theory, the degree of smoothing – the influence of past valuations on current valuations – will be expected to vary with the quantity and quality of transactions evidence. It will be stronger in periods, or in markets, where transactions evidence is thin and perhaps also when the speed or direction of market movements is more uncertain.
Optimal portfolio weights
Using the mean-variance optimization approach with a desmoothing factor of 0.36, I calculated the optimal allocation of real estate in a MAP. (Note: when reviewing the academic research, one needs to bear in mind the general challenges associated with this kind of analysis. Different approaches and desmoothing factors give slightly different results). By taking the return date of equity, bonds, property from 1985 to 2005 we come up with the following allocation that gives the highest sharp ratio.
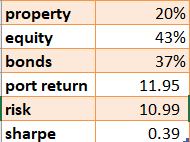
These results are backed up by theory as the median of the suggested allocations to real estate in over 30 reviewed studies was 15 percent with a median range of 6-21 percent. In the following graph wOptimal or suggested allocations to private real estate in selected academic studies.
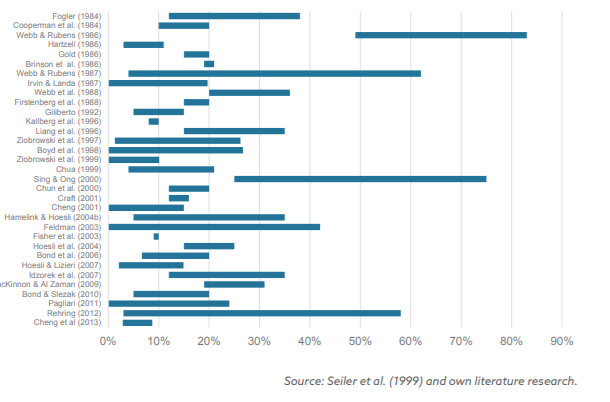
THE DIVERSIFICATION POTENTIAL OF REAL ESTATE. (2015). nordes bank.
Issues with Classic assumptions
In the traditional Markowitz approach, following the classical assumptions, short- and long-term investors should choose the same asset allocation. (Samuelson 1969, Merton 1969).
In reality, these assumptions are likely to be violated because of market frictions. To account for these frictions real estate special characteristics such as high transaction costs, marketing period risk, and return predictability must be addressed in analysing the role of commercial real estate investment in a mixed asset port. Ignoring these characteristics by using mean-variance analysis can lead to misleading results. The investment horizon plays an important role in our analysis.
The long-term approach by Campbell and Viceira is used to estimate the “term-structure of risk” for U.K. stocks, bonds, cash and direct commercial real estate. Using a VAR approach to estimate the term structure of risk, return predictability is considered so that risk is based on the unexpected component of returns. Variances and covariances of returns are computed relative to the conditional return expectations. By using the Campbell and Viceira model, the following conclusions were made about the real estate market:
1) The conditional standard deviation of commercial real estate returns changes with the investment horizon in a similar fashion as it is estimated for stocks
2) Due to high transaction costs, expected real estate returns, per period, are much higher in the long run than in the short run
3) In portfolio optimizations, the allocation to real estate strongly increases with the investment horizon.
Taking these results into account, it’s clear that property assets are a very attractive long-term investment as their expected return strongly increases with the investment horizon. Overall it is suggested by the majority of studies that an allocation of 20 percent appears optimal for an investment horizon of one year, while 60 percent is optimal for an investment horizon of 25 years.
Despite the change in the allocation approach making the assumption more realistic, the optimal allocations to real estate still appear to be high and significantly above the observed actual allocations. The actual allocation to real estate in investor portfolios appears to be very low, giving us the notion of a short investment horizon by investors.
Illiquidity and transaction costs
Real estate markets are far more illiquid than well-developed stock or bond markets, as property sales take time and quick sells lead price reductions. Moreover, liquidity is time varying in real estate markets, with more liquidity in up markets and less liquidity in down markets. Furthermore ‘’price risk underestimates the true ex ante risk and that the effect of marketing period risk decreases with the investment horizon. Also define a second bias, which arises when an investor experiences a sudden liquidity shock, forcing the investor to sell a property quickly.’’ Lin and Vandell (2007)
Transaction costs, being much higher in real estate markets than in well-developed financial markets, lead to less frequent trading. Transaction costs induce horizon effects as the net of transaction costs increases with the investment horizon. Illiquid assets with high transaction costs must offer an expected return premium. Cheng, Lin and Liu (2010) account for marketing period risk, mean aversion in real estate returns and transaction costs and find that there is an optimal holding period for properties, which is estimated to be about 5 years. Note that transaction costs are only important in the short-to-medium term.
Conclusions
This report was made to give an overall review about the benefits and the issues in the analysis of real estate in a mixed asset portfolio. The overall conclusions obtained from this report are the following:
- Real estate can be used as a diversification tool for investment managers
- the correlation of RE with the other asset classes decreases with the increase of investment horizon
- With the use of RE in a MAP the efficient frontier moves up and left opening new investment opportunities
- The increase in de-smoothing coefficient decreases the weight of property, along with Sharpe ratio
- The classical assumptions do not that into account the market frictions
- Investment horizon should always be taken into account as to avoid misleading results.
- Transaction costs have to be taken in to account in the short run while in the long run they are irrelevant.
- Real estate investment better applies to long term investors.